Stereopsis refers to the ability of the visual system to interpret the disparity between the two retinal images leading to the perception of distance or depth. Stereopsis is quantified in terms of stereoacuity which is the minimum angular disparity which can be perceived. Normal stereroacuity varies between approximately 10 and 100 seconds of arc depending on the method/ test used.
Random dot stereograms provide a good method for assessing stereopsis. Pairs of red and green dots are placed randomly within the image and are viewed by the patient through red and green filters so that one eye sees the red dots and the other the green dots. The brain tends to fuse the red and green dots and the separation of the pairs of dots is interpreted as a disparity. Therefore by changing the separation of the dots in part of the image, an illusion of depth can be created and part of the image can be made to “stand out” from the screen.
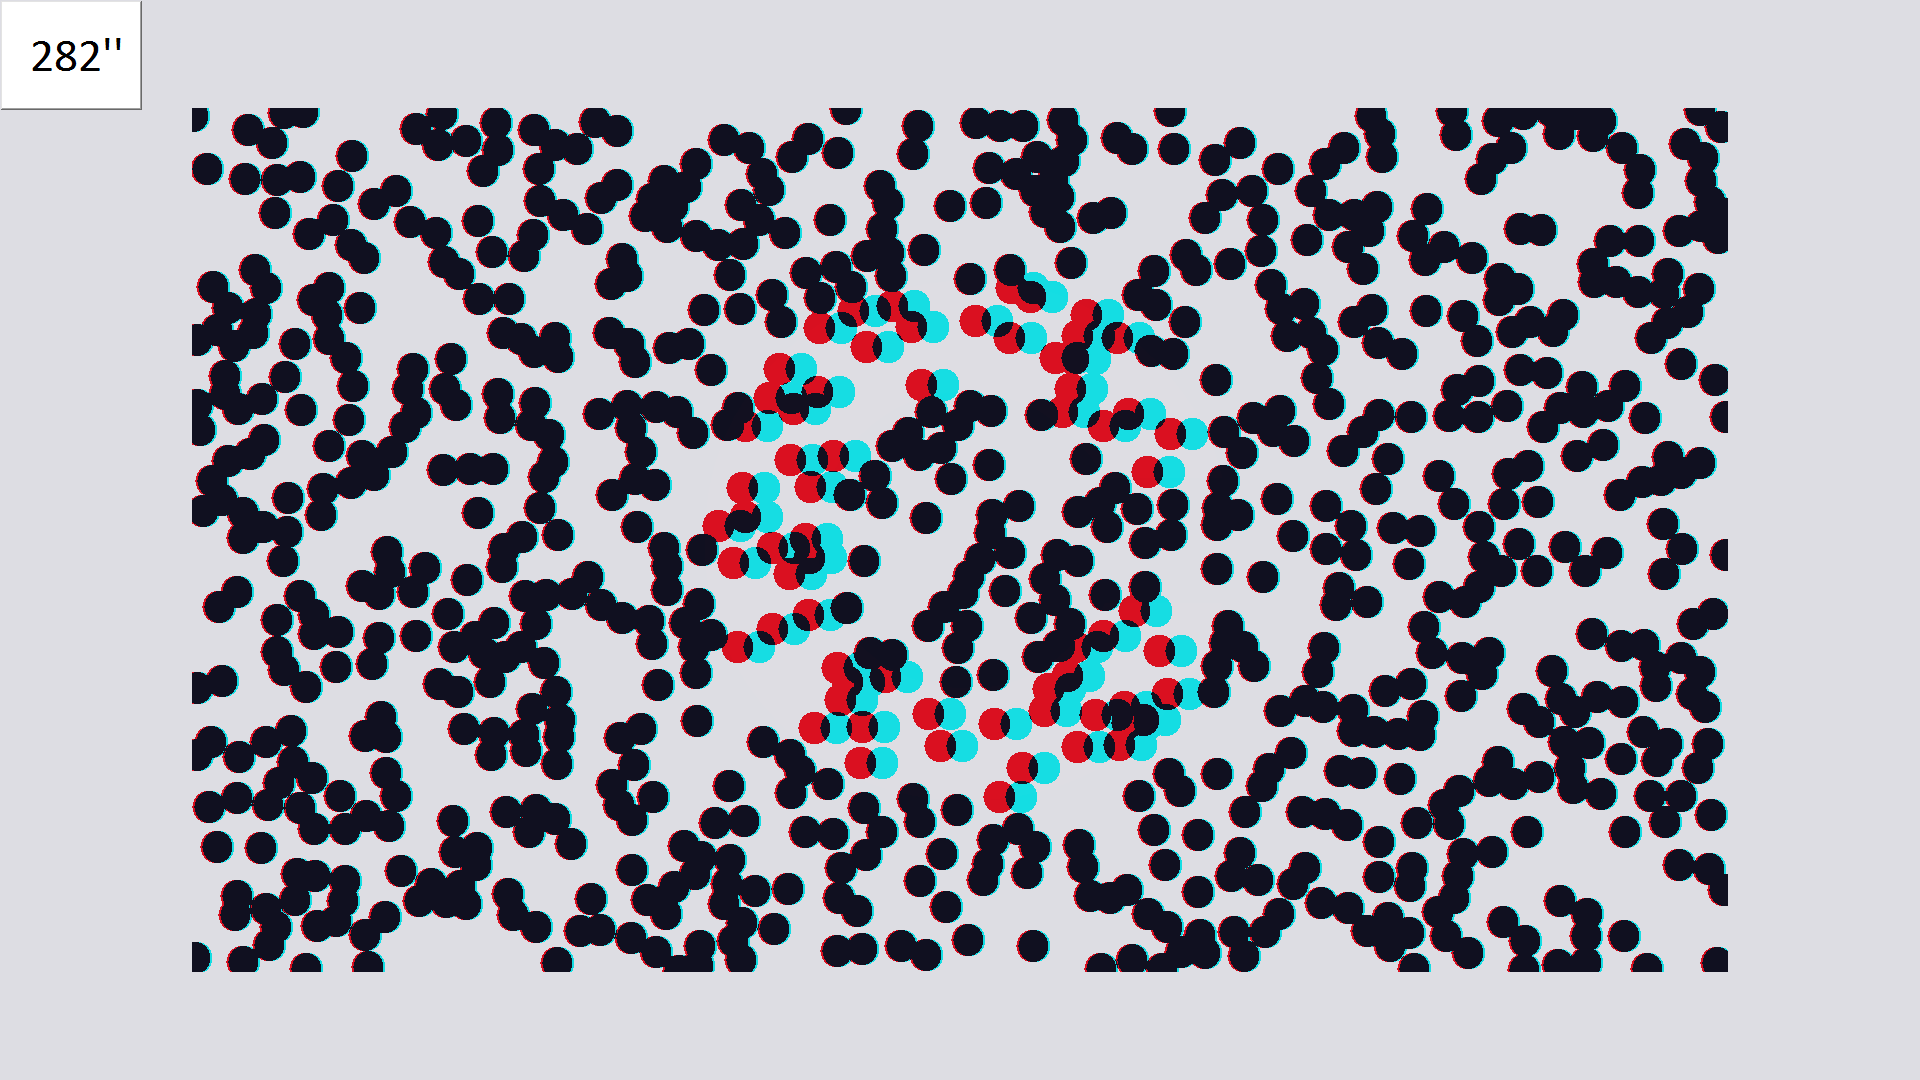
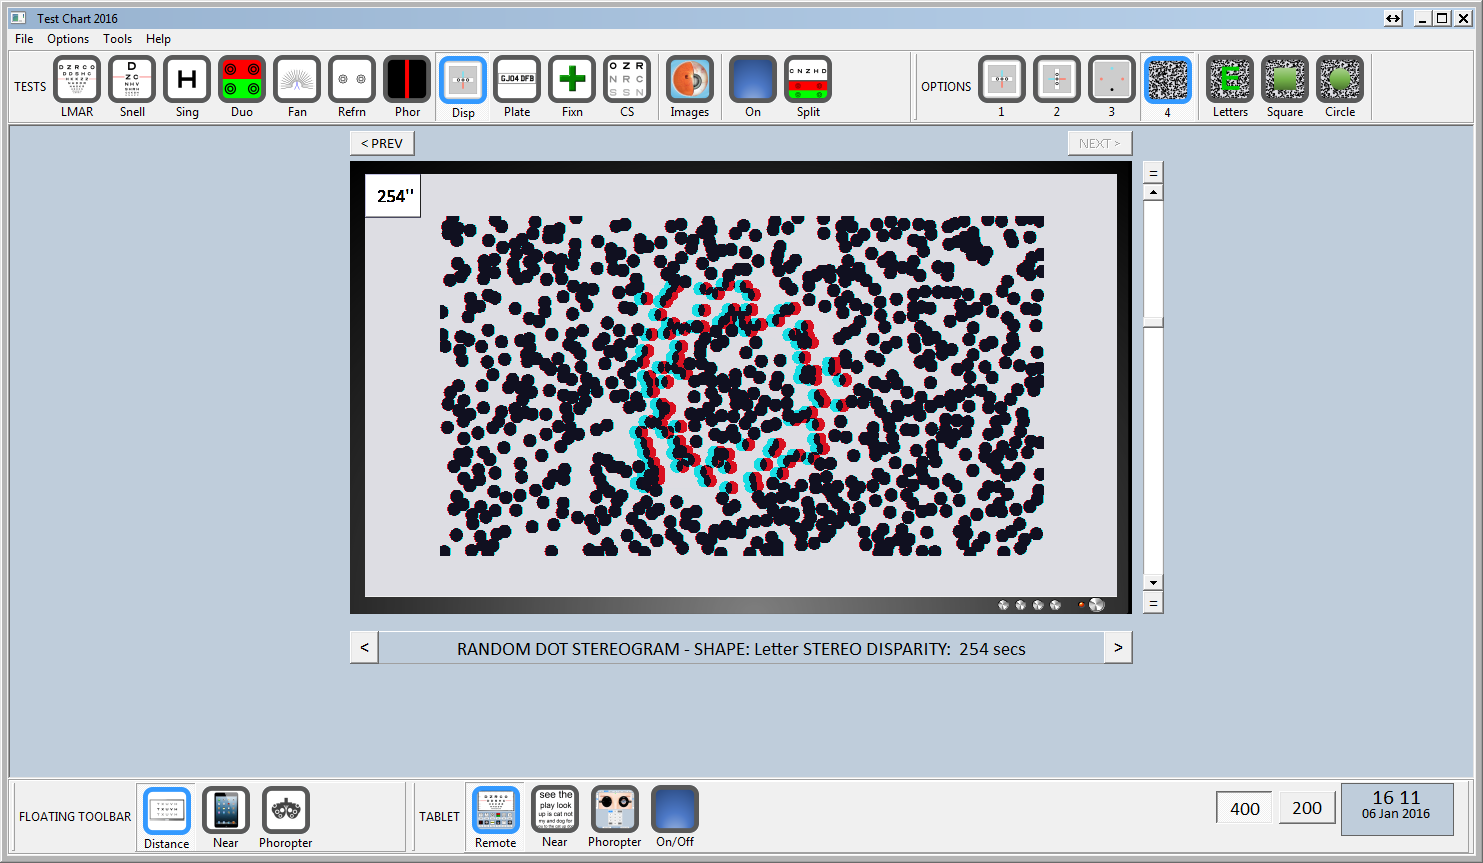
Random dot stereograms
Good stereopsis requires good co-ordination between the eyes and good visual acuity in each eye. Assessment of stereopsis therefore provides the clinician with valuable information about patients’ binocular status and the standard of vision in each eye.
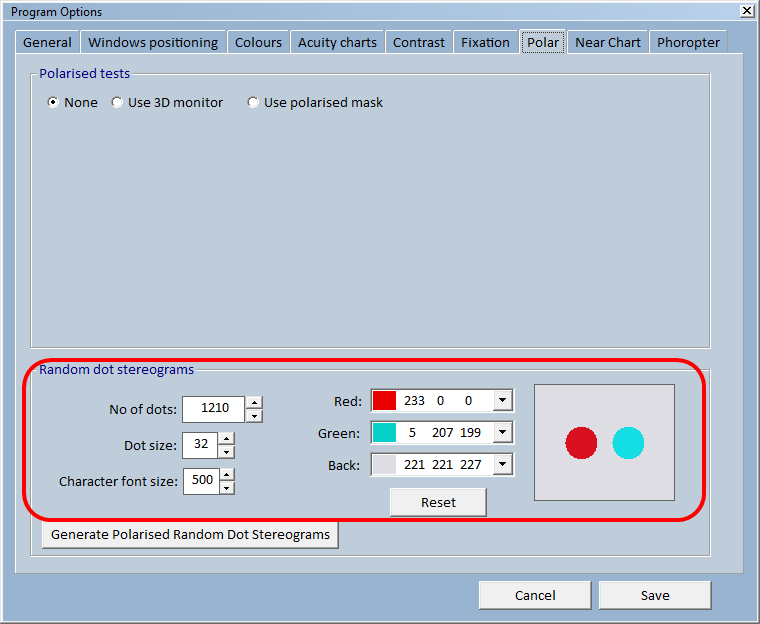
Test Chart 2016 generates stereograms dynamically allowing a range of optotypes to be generated “in depth” within the stereogram. It also allows stereoacuity to be measured by varying the relative disparity within the stereogram. This process may take a few seconds on slower machines. The number of dots generated, the size of the optotype and the disparity of the background can all be changed via the Polar tab of the Options...General Settings window.
There are a number of vision tests available for measuring stereopsis at near and a rich literature describing norms. In contrast, there are very few tests capable of measuring stereopsis in the distance and relatively little information about norms and the optimum stimulus parameters.
For this reason Test Chart 2016 allows the user to vary the number/density of dots, the dot size and the size of the character that is seen in depth. The colours of the dots may also be changed to provide the best match for the screen and red/green visors. NOTE: The colours are added subtractively to the background and it is recommended that you contact Thomson Software Solutions should you wish to change the colours.
The viewing distance for this test can also be set independently of the viewing distance used for the rest of the program.
Given the paucity of published norms for distance stereopsis, the clinician is expected to develop their own norms for the conditions selected.
Test Chart 2016 is capable of generating stereograms of the letters, a square or a circle. When the stereopsis test is selected, the Secondary toolbar is expanded to include 3 more buttons as shown.
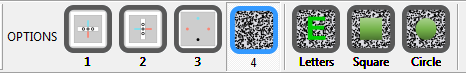
The three stimuli may be selected by clicking on the corresponding icon in the Secondary Toolbar or by pressing L, M and R respectively on the keyboard or remote.
The stereo disparity may be changed using the vertical scrollbar on the Floating Control Window or by pressing the vertical cursor control keys on the keyboard or remote.
The current stereo disparity is shown in a small window on the test chart screen and also on the Test Information Bar of the Floating Control Window as shown below.
Summary
|
Mouse Click on the Letters, Square or Circle icon to display these stimuli in depth, Use the vertical scroll bar in the Floatin Control Window to change the disparity. |
Keyboard L Selects letters M Selects the square R Selects the circle The vertical cursor control keys change the disparity. |
|
|
Remote L Selects letters M Selects the square R Selects the circle The vertical cursor control keys change the disparity. |