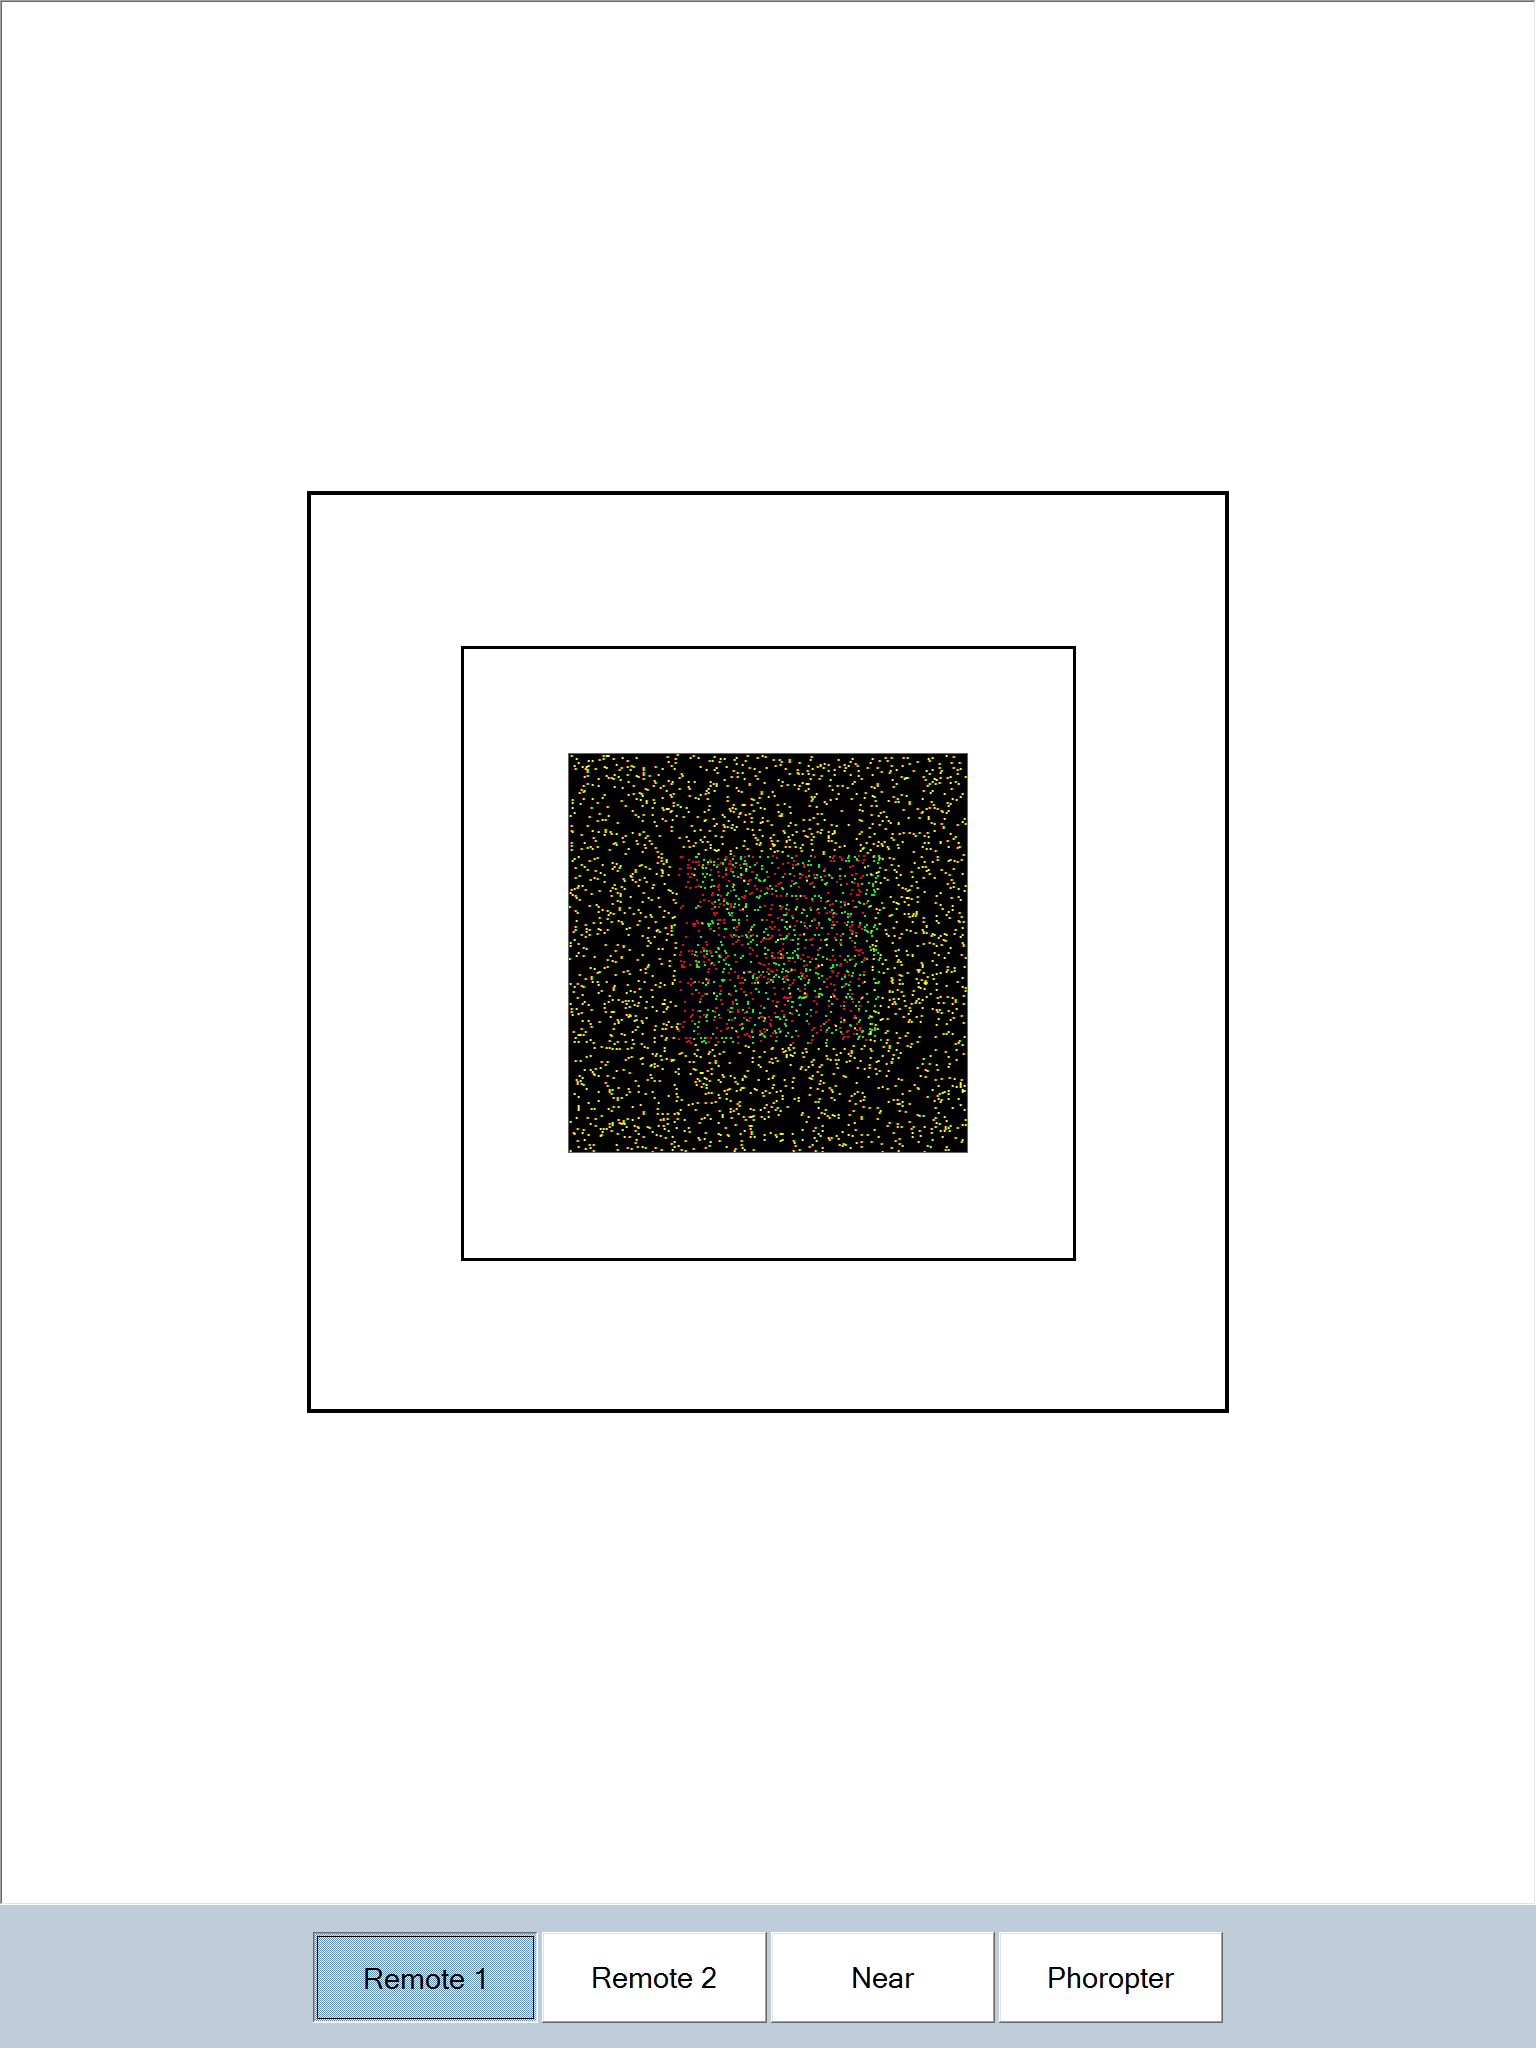
Random dot stereograms provide a good method for assessing stereopsis. Pairs of red and green dots are placed randomly within the image and are viewed by the patient through red and green filters so that one eye sees the red dots and the other the green dots. The brain tends to fuse the red and green dots and the separation of the pairs of dots is interpreted as a disparity. Therefore by changing the separation of the dots in part of the image, an illusion of depth can be created and part of the image can be made to “stand out” from the screen.
Good stereopsis requires good co-ordination between the eyes and good visual acuity in each eye. Assessment of stereopsis therefore provides the clinician with valuable information about patients’ binocular status and the standard of vision in each eye.
Test Chart 2016 generates stereograms dynamically allowing a range of optotypes to be generated “in depth” within the stereogram. It also allows stereoacuity to be measured by varying the relative disparity within the stereogram. This process may take a few seconds on slower machines.

The disparity (in pixels) can be changed using the frame shown in the Secondary toolbar. The disparity is varied using the Up/Down arrows on the Secondary Toolbar or using the Vertical Cursor Control keys on the keyboard or the remote control. The corresponding stereoacuity is calculated from the calibration data and the viewing distance and is displayed.
NOTE: Positive or negative disparities can be generated resulting in shapes that appear in front or behind the plane of the screen respectively.
Test Chart 2016 is capable of generating random dot stereograms of various Shapes (Square, Circle, Triangle and Heart) and Letters. These options are selected by clicking on the corresponding buttons in the Secondary Toolbar.