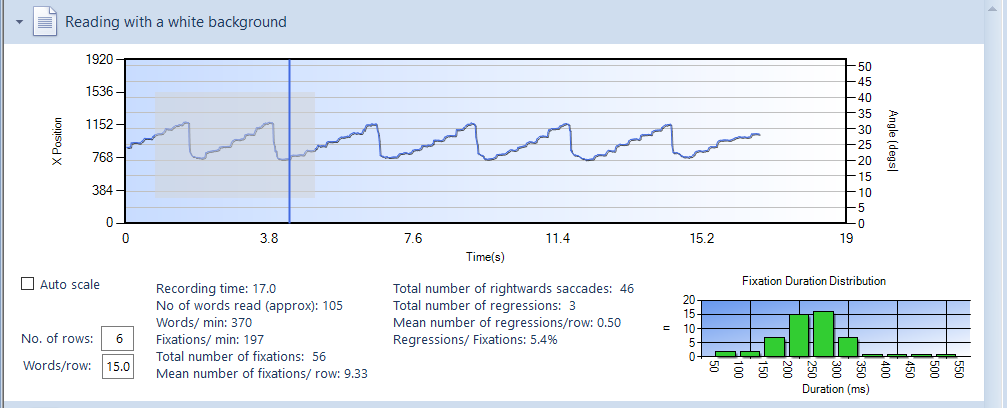
Horizontal eye movement panel
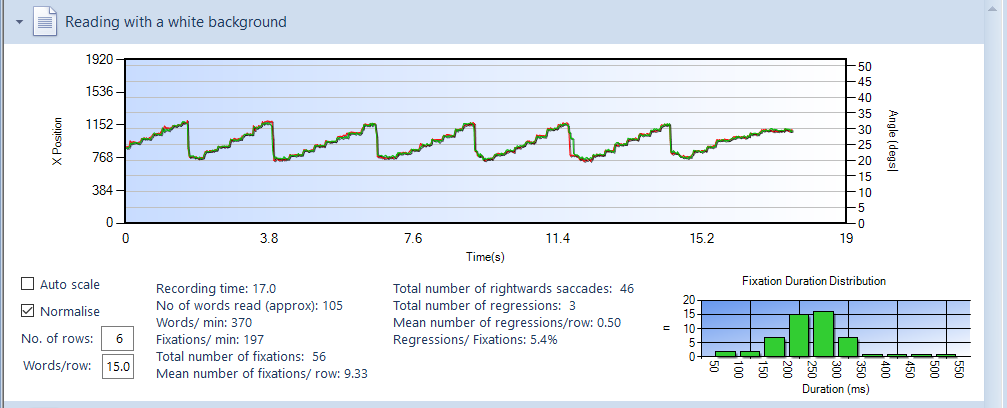
The horizontal eye movement panels show the horizontal eye movements as a function of time. The primary Y axis shows the X-Position in pixels. The secondary Y axis shows the Angle in degrees. This is based on the size of the screen entered via the Program options and the average viewing distance throughout the recording.

The trace above shows a typical pattern of eye movements while reading, showing an alternation of fixations and left to right saccades followed by a large right to left saccade at the end of a row.
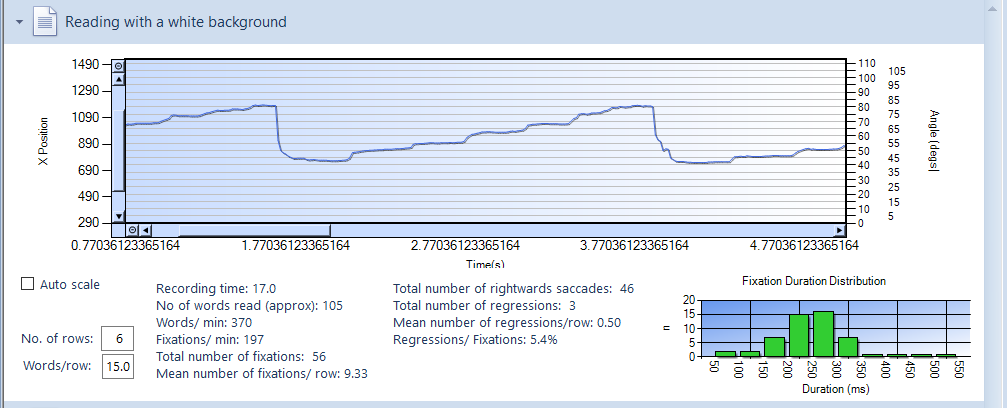
Zooming
To examine part of the trace in more detail, a rectangle may be drawn by holding down the left mouse button and dragging the mouse from the top left corner to the bottom right corner of the require rectangle as shown below.
This will zoom in to display the trace within the rectangle only as shown below.
To zoom out, click on the small circles next to the horizontal and vertical scroll bars or select Zoom out on the main toolbar.
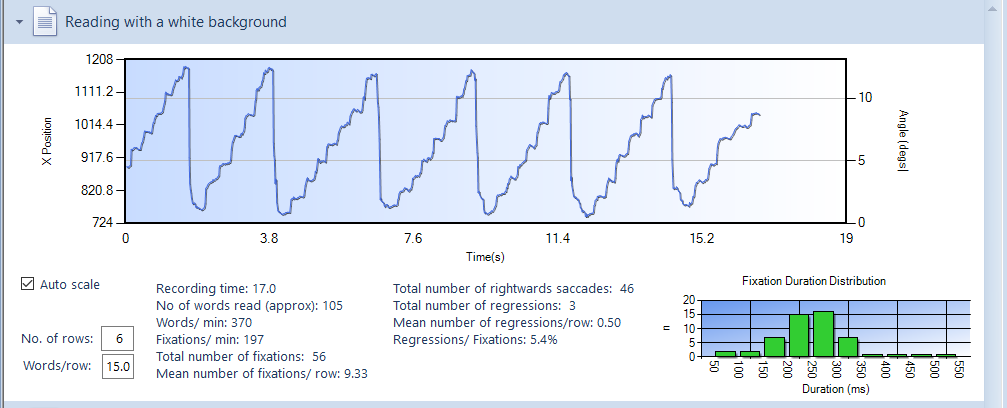
Alternatively, selecting Auto scale zooms the Y axis so the trace fills the chart as shown below.
By default, the graphs show the mean position of the right and left eyes. Clicking on Binoc in the main toolbar changes the display to Monoc and shows the eye position for the right and left eyes (red and green respectively) as shown below.
This provides a powerful way to examine binocular status throughout the recording.
The Normalise check box indicates that the average offset between the two traces has been set to zero. This means that only transient changes in fixation position will be shown and any steady-state deviation (tropia) will be concealed. The examiner should decide if the data should be normalised depending on the nature of the analysis. For most purposes, this option should be selected.
Summary statistics.
Summary statistics relating to the recording have been extracted using various algorithms developed by Thomson Software Solutions. These algorithms depend on a "clean" recording and will become unreliable if the data is "noisy".
No of rows
The algorithm identifies large right-to-left to saccades and uses these to signify the end of a row. It does not include rows partially read.
Words/row
The algorithm counts the number of words on each row. If there are a different number of words per row, it gives the mean.
Recording time
The total recording time in seconds.
No or words read
The algorithm attempts to identify the last word read and counts the number of words to that point.
Words/min
The number of words read divided by the recording time is used to calculate the reading speed in words/minute.
Fixations/min
The algorithm counts the total number of fixations and divides it by the recording time to calculate the number of fixations per minute.
Total number of fixations
The algorithm counts the total number of fixations.
Mean number of fixations/row
The total number of fixations is divided by the number of rows read.
Total number of rightward saccades
The algorithm calculates the total number of rightward saccades. These are normally the small saccades from one word to the next.
Total number of regressions
The algorithm calculates the total number of small leftward saccades. These are known as regressions and normally represent occasions where the patient has gone back to re-read a word. Those having difficulty reading generally make more regressions.
Mean number of regressions/row
The total number of regressions divided by the number or rows read.
Regressions/Fixations
The number of regression divided by the number of fixations expressed as a percentage. Poor readers generally have a higher ratio of regressions to fixations.
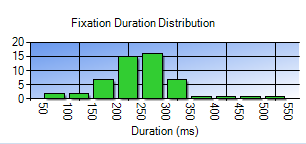
Fixation Duration Distribution
This shows a frequency distribution of the duration of the fixations throughout the recording. In general, good readers have a lower median fixation duration and few long duration fixations.