Baseline results
The top panel shows the outcome of the Baseline results - i.e. results obtained with a white background.
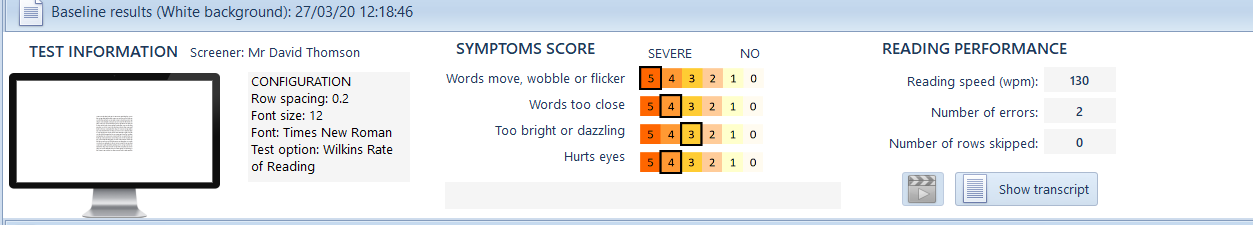
The software allows for multiple baselines so that changes in symptoms and the Reading Speed can be monitored over a period of time. The date and time of each baseline result is shown in the list on the left of the panel. The current baseline is denoted by a green dot.
To show a specific baseline result, simply click on the date of the result in the list. By default, the most recent baseline result will be shown.
Test information
The test information give the name of the screener entered at the time of the test and the configuration of the test. The thumbnail shows an image of the test screen configuration.
Symptoms score
The grading for each symptom (on a scale of 0-5) is shown graphically in the Symptoms panel.
The graphical format allows for a rapid comparison of the baseline symptoms and the symptoms with the optimum colour.
Reading Performance
The Reading Performance panel shows the Reading Speed in words/minute, the number of errors made and the number of rows skipped.
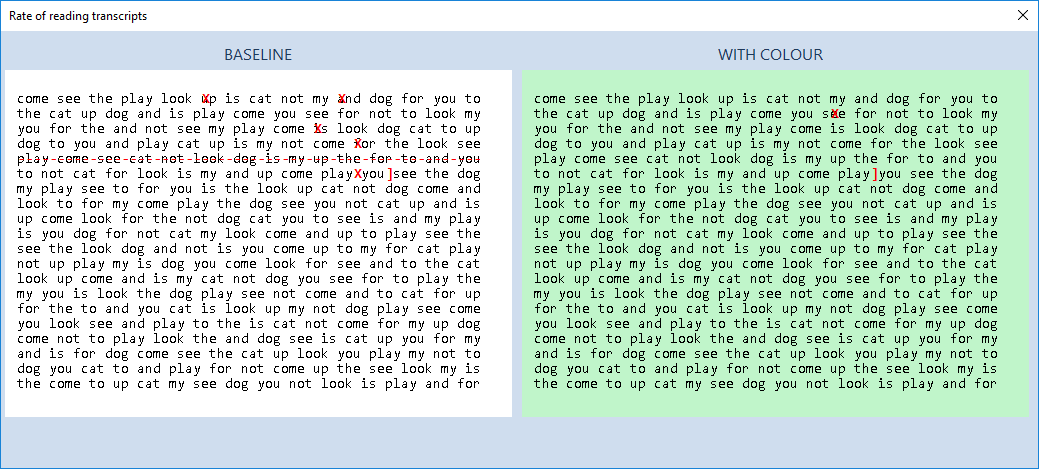
Clicking on Show Transcript displays the transcript recorded during the Reading Speed test.
If a video recording has been made during the test, the Play video icon will be enabled. Selecting this will display the Video player window as shown below.
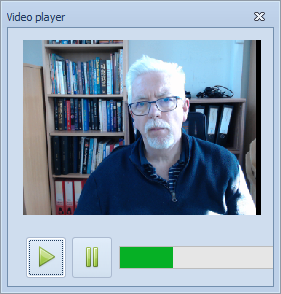
The video can be played or paused using the corresponding Play and Pause buttons. To view specific frames, click on the progress bar.