Saccade Analysis
The Clinical Eye Tracker 5L includes a Saccade Analysis module which automatically analyses the pattern of eye movements made during the Saccade test.
The saccade test can be customised from the Stimulus selection screen.
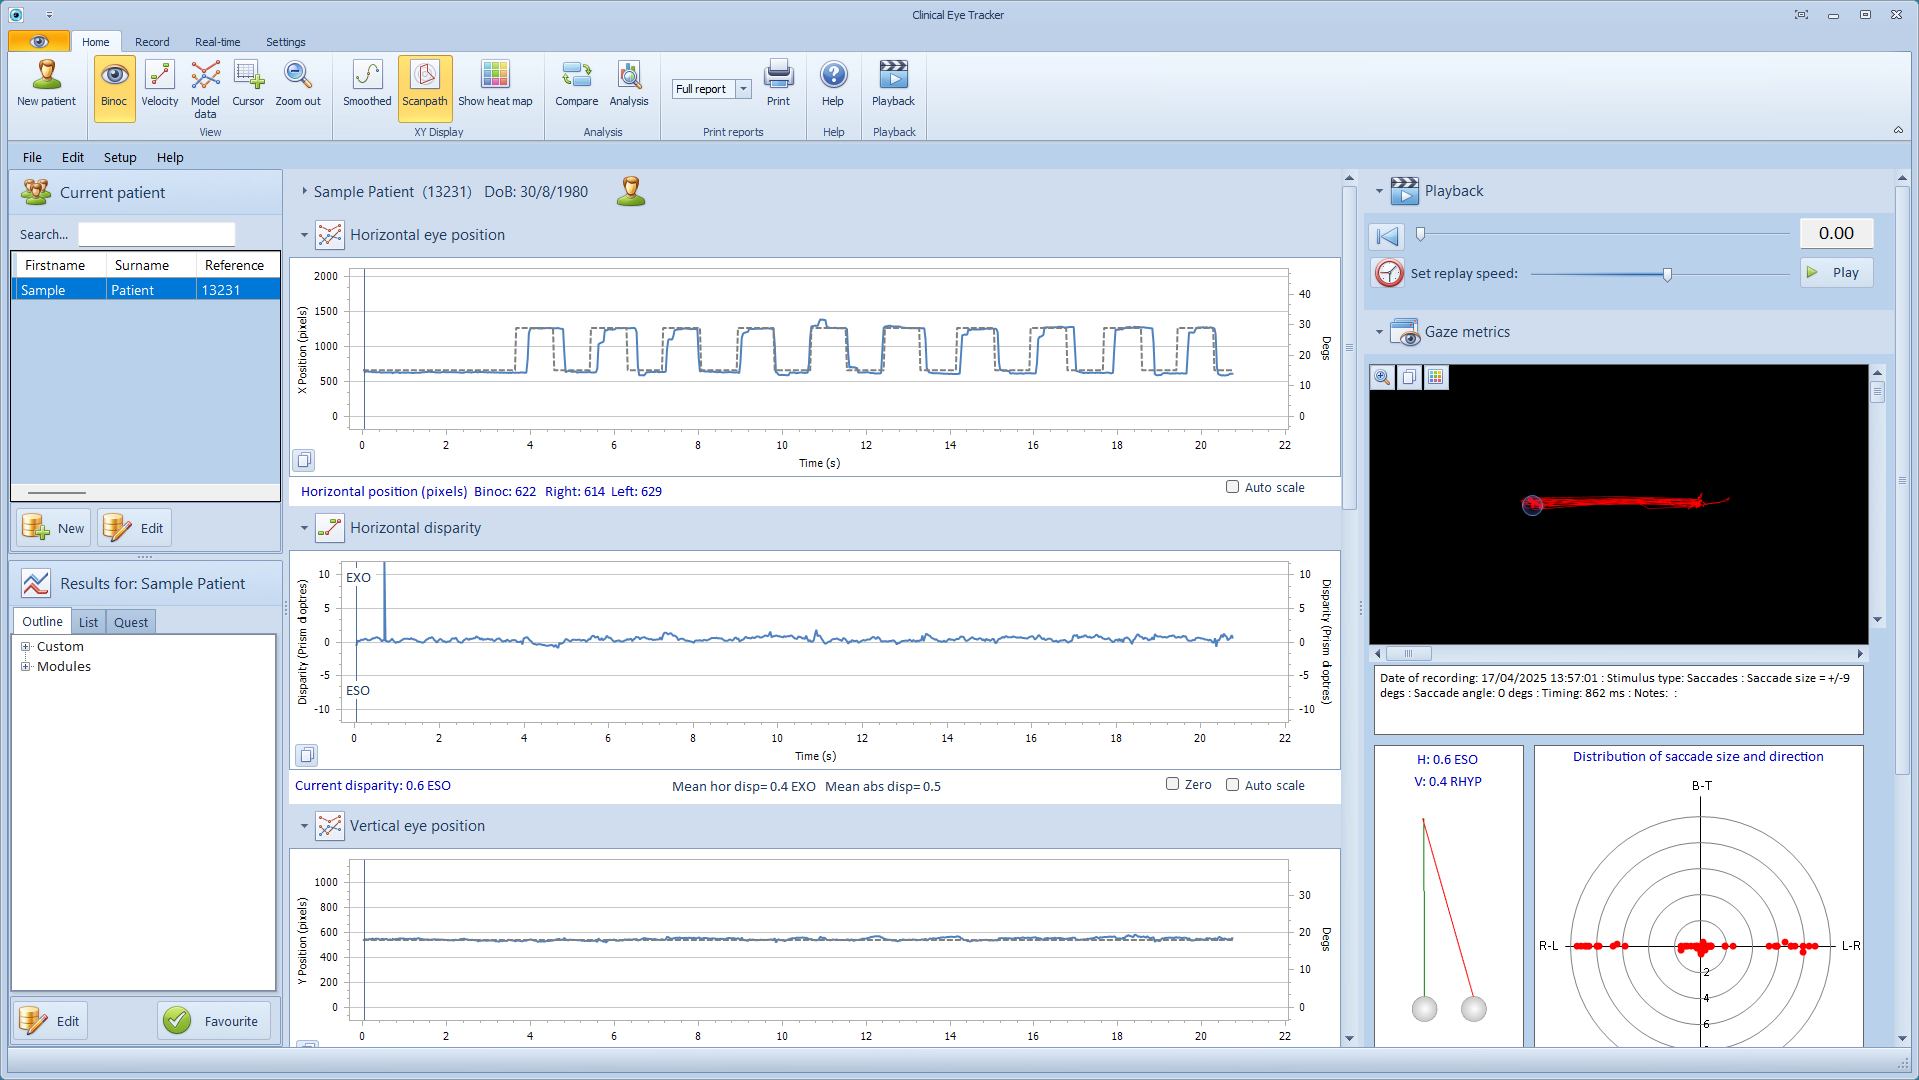
The results can be displayed on the Control screen in the normal manner. The location of the target is shown by the dotted grey line.
For a more detailed analysis, select Analysis from the Home toolbar.
This will display the Saccade Test Analysis window shown below:
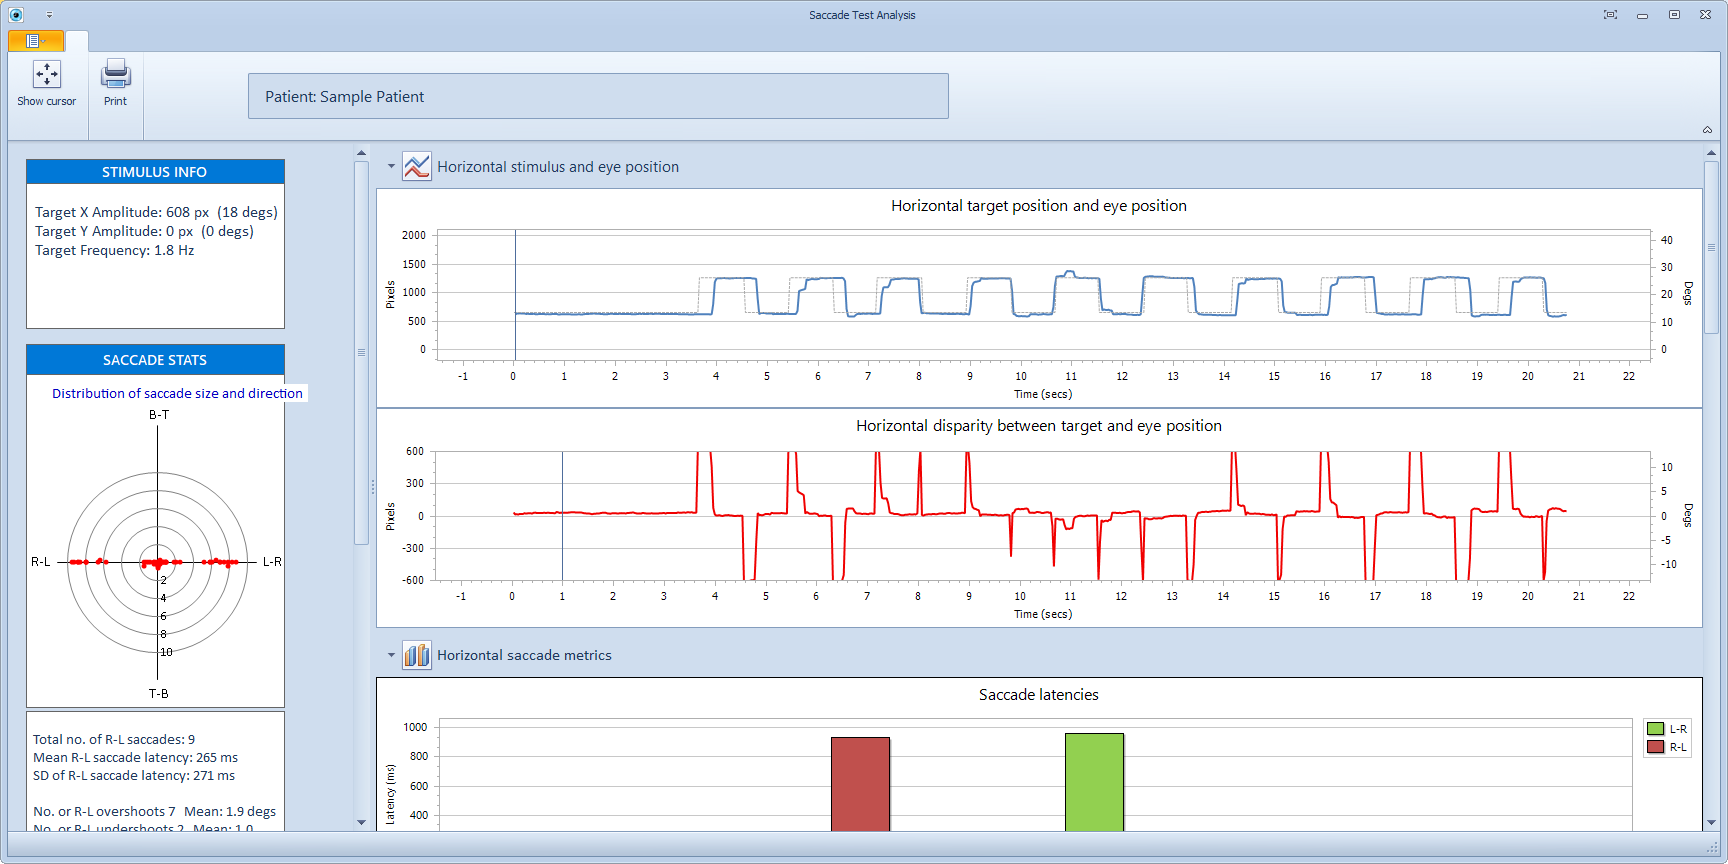
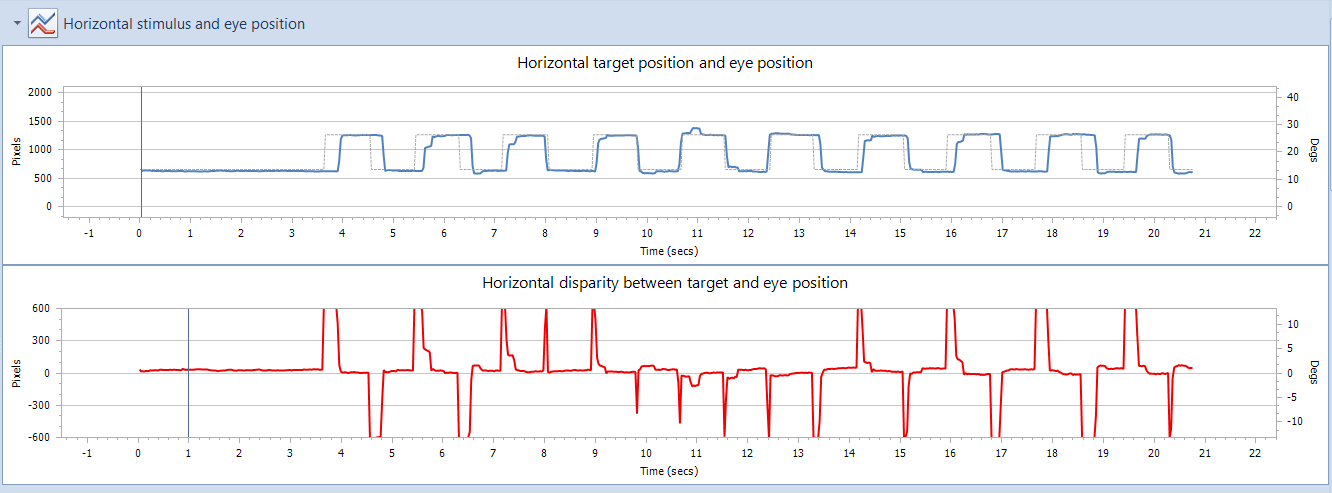
The first panel shows the horizontal target position (grey dotted line) and the horizontal eye movements (blue line).
The second panel shows the difference in the horizontal location of the target and the eyes. If the horizontal gaze position corresponds with the target position, the disparity will be zero. The graph below show a disparity representing the reaction time between the target moving and a saccade being initiated.
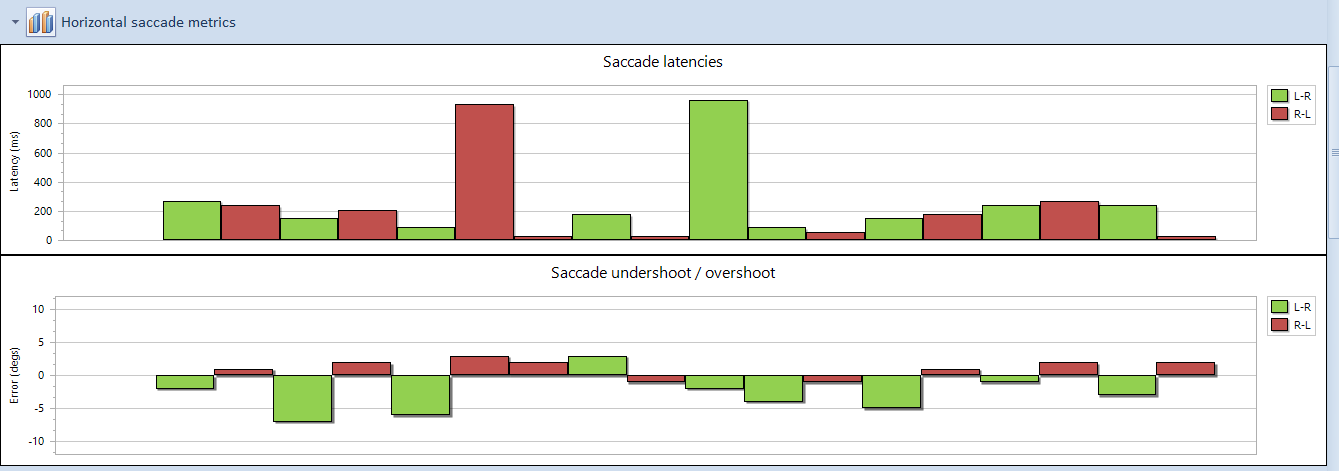
The third panel shows the latency between the target moving at the start of the next saccade. Left-to-right and Right-to-left saccades are shown in green and red respectively.
The fourth panel indicates the accuracy of the saccade showing undershoot and overshoots of the saccade relative to the target.
Identical panels are shown for the vertical components of the saccades.
The current test conditions are shown in the Stimulus Info panel as shown below:
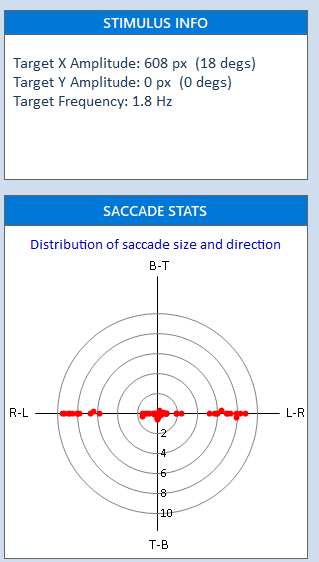
The Distribution of saccade size and direction panel shows a graphical representation of the distribution of saccade size and saccade direction.
For example, the chart above shows a typical distribution of saccades while performing the saccade test, with a cluster of large left-to-right and right-to-left saccades representing the saccades made as the patient follows the target. The cluster of smaller saccades represents the saccades made to correct under and overshoots.
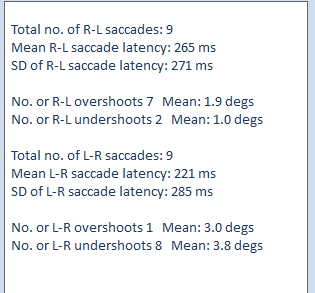
Summary statistics are available in the Summary stats panel.
XY DISPLAY
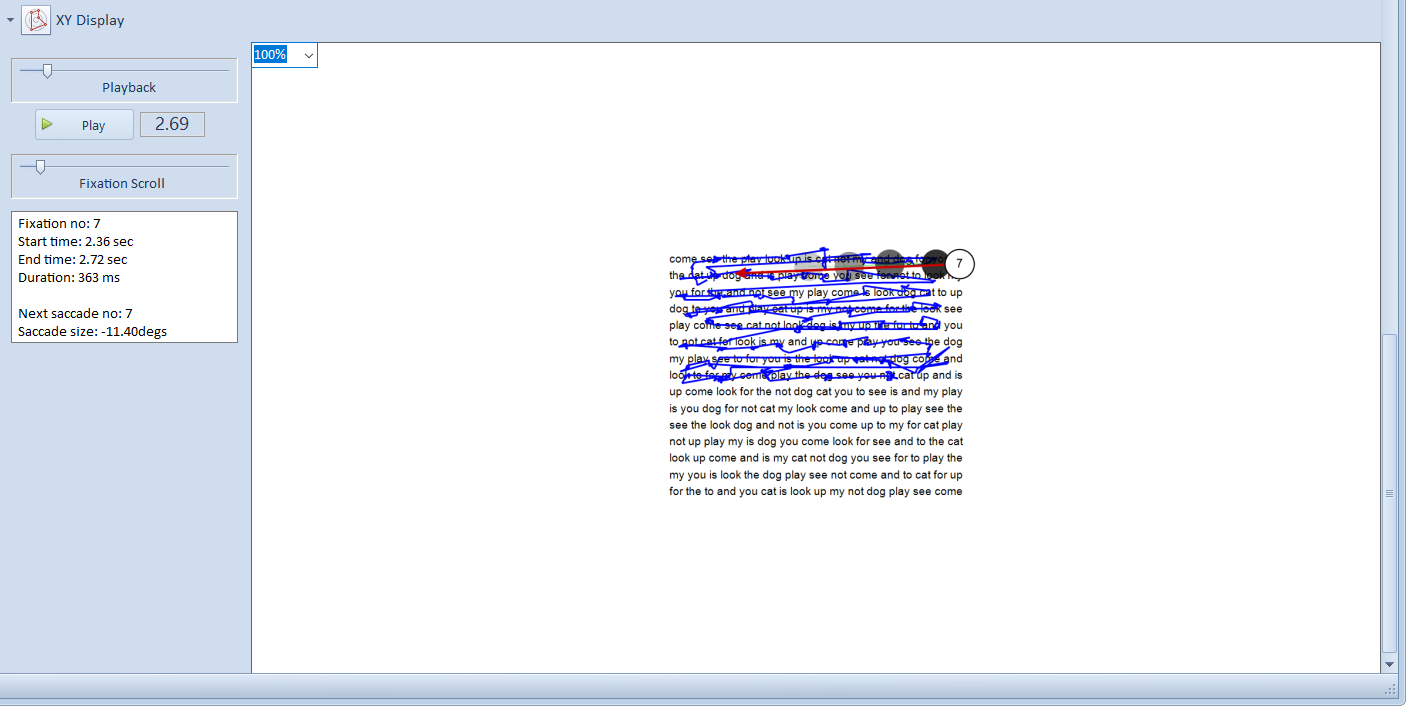
The XY display allows a detailed visual examination of the fixations and saccades made during the recording. This can be very useful when examining the precise pattern of eye movements while performing a specific task.
The XY display shows the scan-path of eye movements superimposed on the test stimulus. Superimposed on this is the current fixation location with a trail showing previous fixations. The example below shows the seventh fixation identified in the recording with a fading trail showing the location of the previous five fixations. The red arrow shows the location of the next fixation. The information panel displays:
Fixation number: The current fixation number
Start time: The start time of the current fixation
End time: The end time of the current fixation
Duration: The duration of the current fixation
Next saccade: The next saccade number
Saccade size: The size of the next saccade (negative is R-L)
To scroll through the recording, select Play or use the Playback scroll bar.
To show each fixation sequentially, use the Fixation Scroll scroll bar.
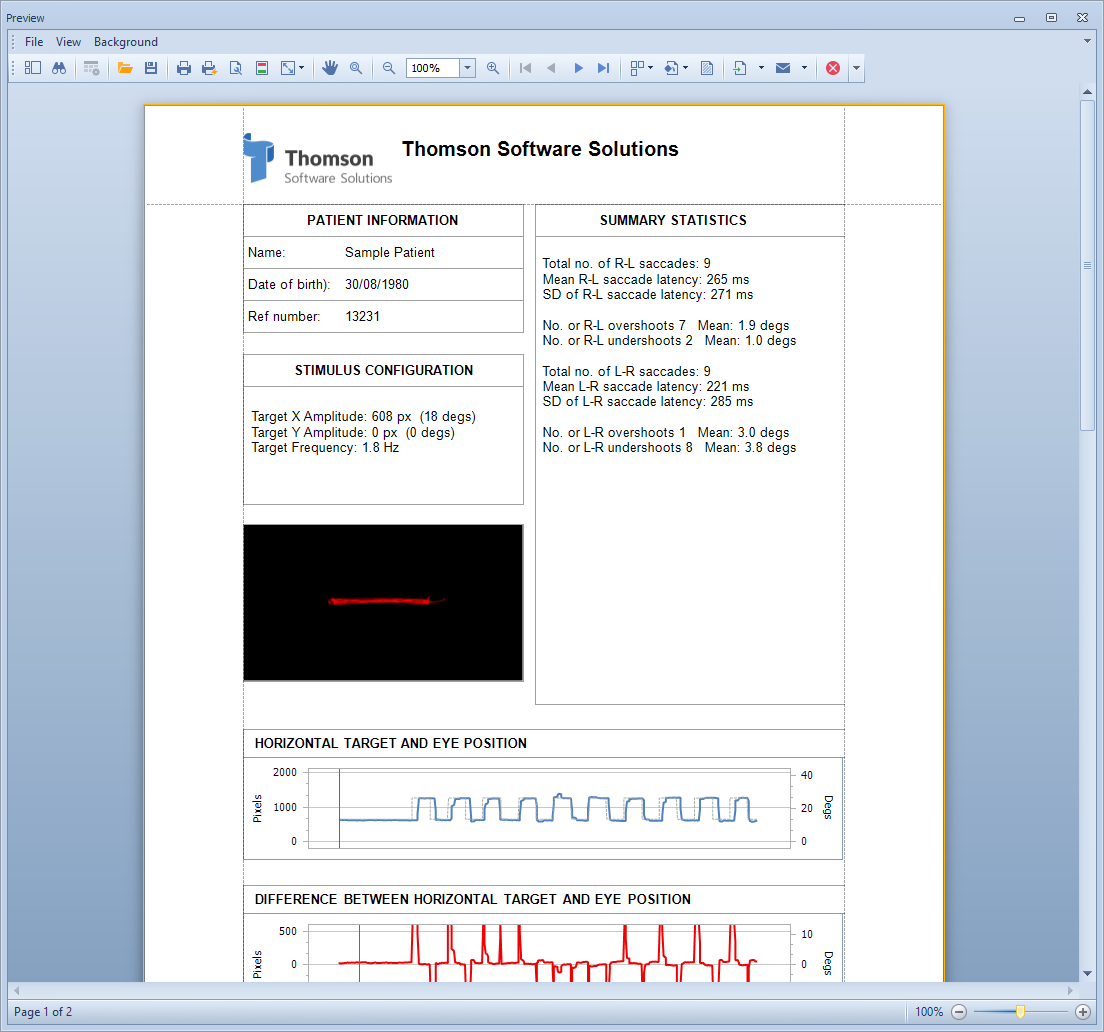
ANALYSIS REPORT
A report showing the Analysis can be printed by selecting the Print button. This will show the Print preview screen as shown below which allows a number of print options to be set before printing.