Reading Analysis
The Clinical Eye Tracker 5L includes a Reading Analysis module which automatically analyses the pattern of eye movements and produces a statistical summary.
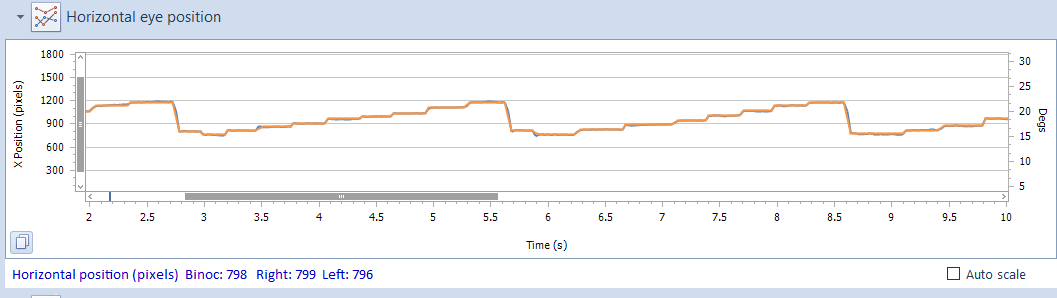
The Analysis module first models the eye movement data to break it down into a series of saccades and fixations as described under Showing the model gaze trace.
An example of the modeled data (orange) and actual eye position (blue) is shown below:
To show the Analysis window, select Analysis from the toolbar.
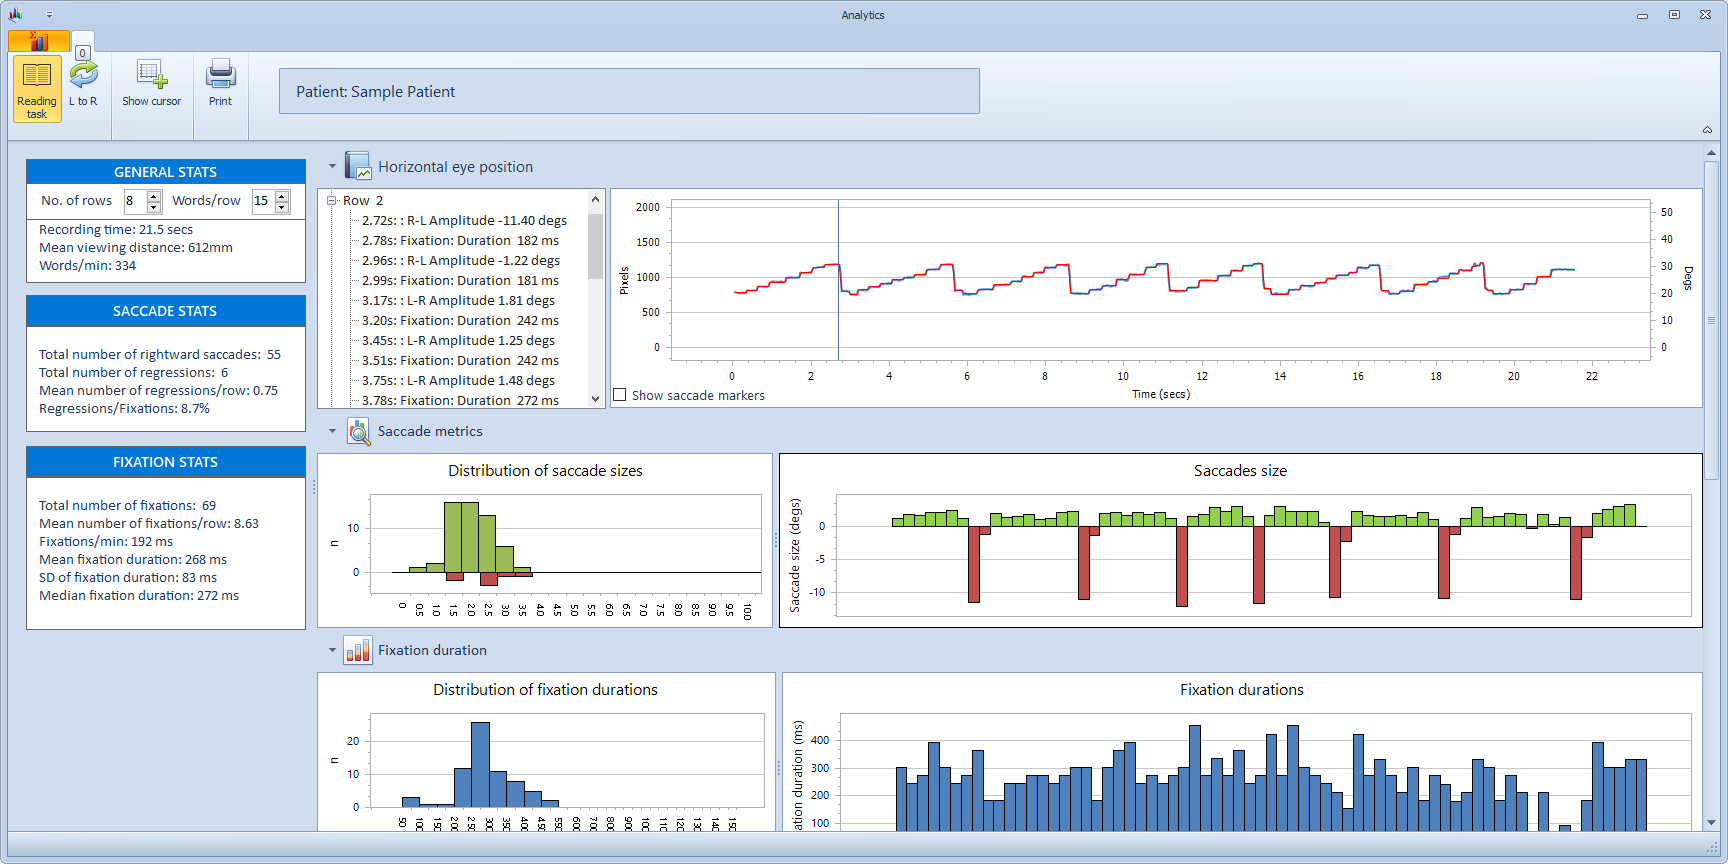
This will display the Analysis window shown below:
Outline summary
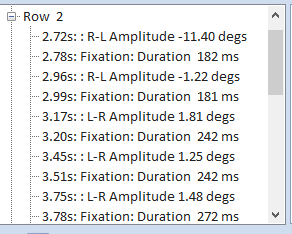
The first panel shows a breakdown of the saccades and fixations identified. For Reading tasks, this is broken down into rows (identified by the presence of a large right to left saccade at the end of the row). The algorithm will fail with very unusual patterns of eye movements which do not include a right to left saccade which meets this criterion.
The top level of the outline includes a summary of the number of saccades and regressions on each row. Expanding this reveals an analysis of the saccades and fixations made on this row along with the approximated duration of the fixation and size of the saccade.
Note: the accuracy of these measurements is limited by the sampling rate of the hardware and the accuracy of the eye tracker (approximately 0.5 degrees). A number of alternative eye tracking systems are available from Tobii if greater precision is required.
Clicking on a specific element in the list, automatically moves the cursor on the main display window to the corresponding time on the traces so that each saccade and fixation can be individually identified.
For non-reading tasks, the division by rows is removed so the outline control simply shows a continuous series of saccades and fixations.
Reading task mode can be toggled on and of use the Reading task button in the taskbar.
GENERAL STATS
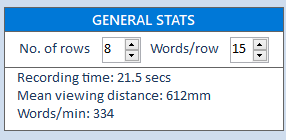
The number of rows shows the number of rows read by the patient as identified by the model data algorithm. A row is identified by the presence of a large right-to-left saccade at the end of the row. For unusual/irregular patterns of eye movements where the patient may return to the beginning of the row before completing the row, this can lead to an incorrect row count. If this is the case, the row count can be manually adjusted using the up/down control. The number of rows identified affects a number of the indices calculated below.
- No. of rows: number of rows read as identified by the algorithm. If this is incorrect, the value can be edited. This value is used to calculate the Words/min.
- Words/row: this is the average number of words on each row of the text read by the patient. For the Rate of Reading test this is 15. If other text has been used, enter the average number of words on each row.This value is used to calculate the Words/min.
- Recording time: total recording time in seconds
- Words/min: estimate of reading speed in words/min based on the No. of rows value, the Words/row and the Recording time.
SACCADE METRICS
The estimated amplitude of each saccade in the recording is shown in the panel shown below:
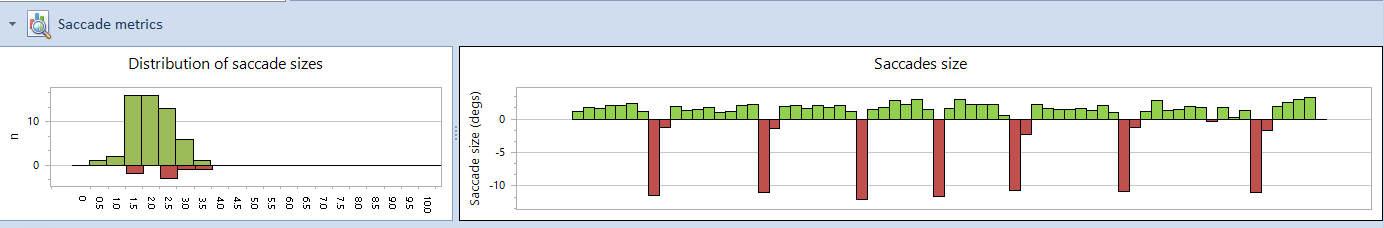
Rightward saccades are shown as positive and leftward saccades as negative. The normal pattern of eye movements when reading therefore consists of a series of small rightward saccades, followed by a large leftward saccade as the eyes return from the end of the row to the beginning of the next.
Regressions are identified as small leftward saccades.
Distribution of saccade size
A frequency distribution of the data shown above is also shown. This allows a rapid assessment of the distribution of the saccade size and comparison between patients.
Summary statistics relating to these data are show under SACCADE STATS.
- Total number of rightwards saccades: total number of rightwards saccades identified during the recording
- Total number of regressions: total number of small leftward saccades (regressions).
- Mean number of regressions/ row: total number of regressions divided by No.of rows.
- Regressions / Fixations: total number of regressions divided by the total number of fixations expressed as a percentage.
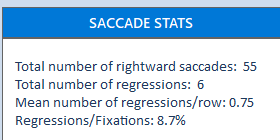
FIXATION DURATION
The estimated duration of each fixation in the recording is shown in the Fixation duration panel:
This chart allows any trends in fixation duration throughout the recording to be readily identified.
Distribution of fixation duration
A frequency distribution of the data shown above is also shown. This allows a rapid assessment of the distribution of the fixation duration and comparison between patients.
Summary statistics relating to this data are show under FIXATION STATS.
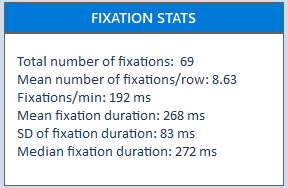
- Total number of fixations: total number of fixations identified during the recording
- Mean number of fixations/row: total number of fixations identified divided by the No. of rows.
- Fixations/min: total number of fixations per minute.
- Mean fixation duration: Mean fixation duration for the entire recording
- SD of fixation duration: Standard deviation of fixation duration distribution
- Median fixation duration: Median of fixation duration distribution
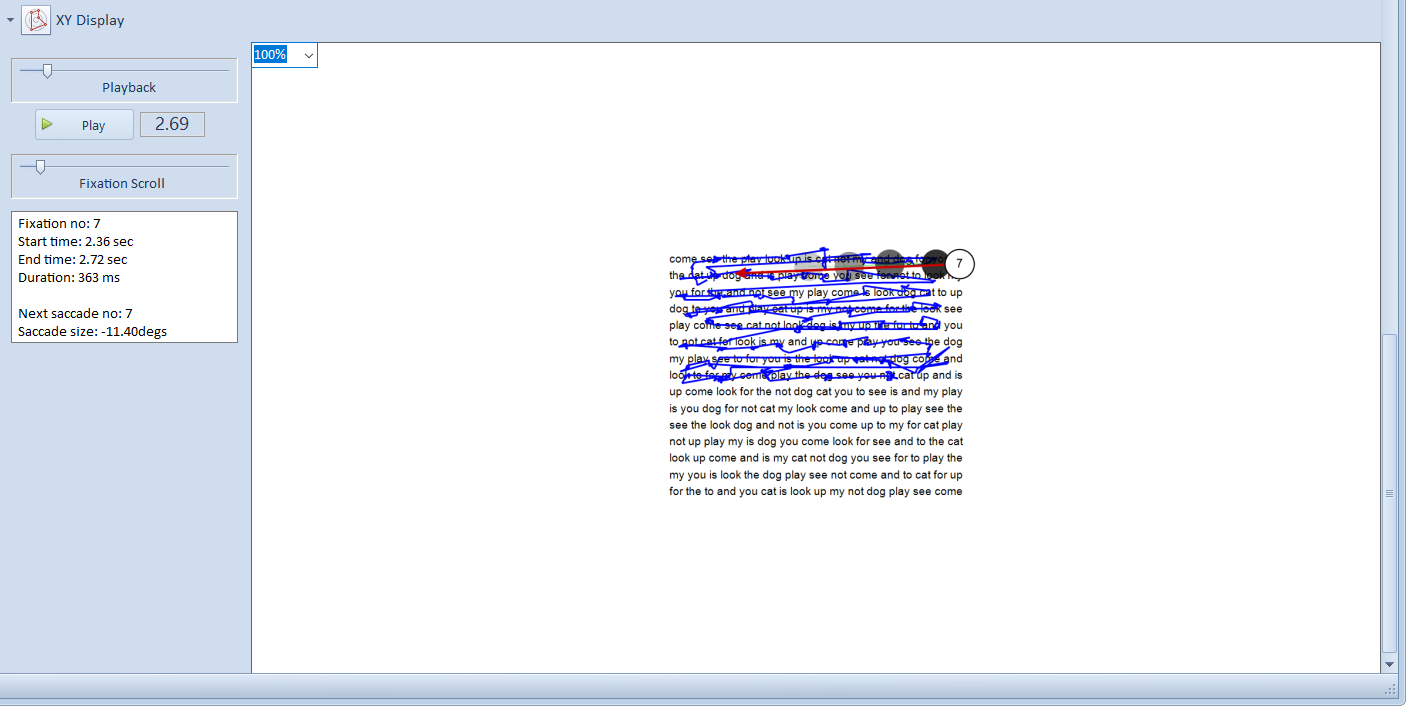
XY DISPLAY
The XY display allows a detailed visual examination of the fixations and saccades made during the recording. This can be very useful when examining the precise pattern of eye movements while performing a specific task.
The XY display shows the scan-path of eye movements superimposed on the test stimulus. Superimposed on this is the current fixation location with a trail showing previous fixations. The example below shows the seventh fixation identified in the recording with a fading trail showing the location of the previous five fixations. The red arrow shows the location of the next fixation. The information panel displays:
Fixation number: The current fixation number
Start time: The start time of the current fixation
End time: The end time of the current fixation
Duration: The duration of the current fixation
Next saccade: The next saccade number
Saccade size: The size of the next saccade (negative is R-L)
To scroll through the recording, select Play or use the Playback scroll bar.
To show each fixation sequentially, use the Fixation Scroll scroll bar.
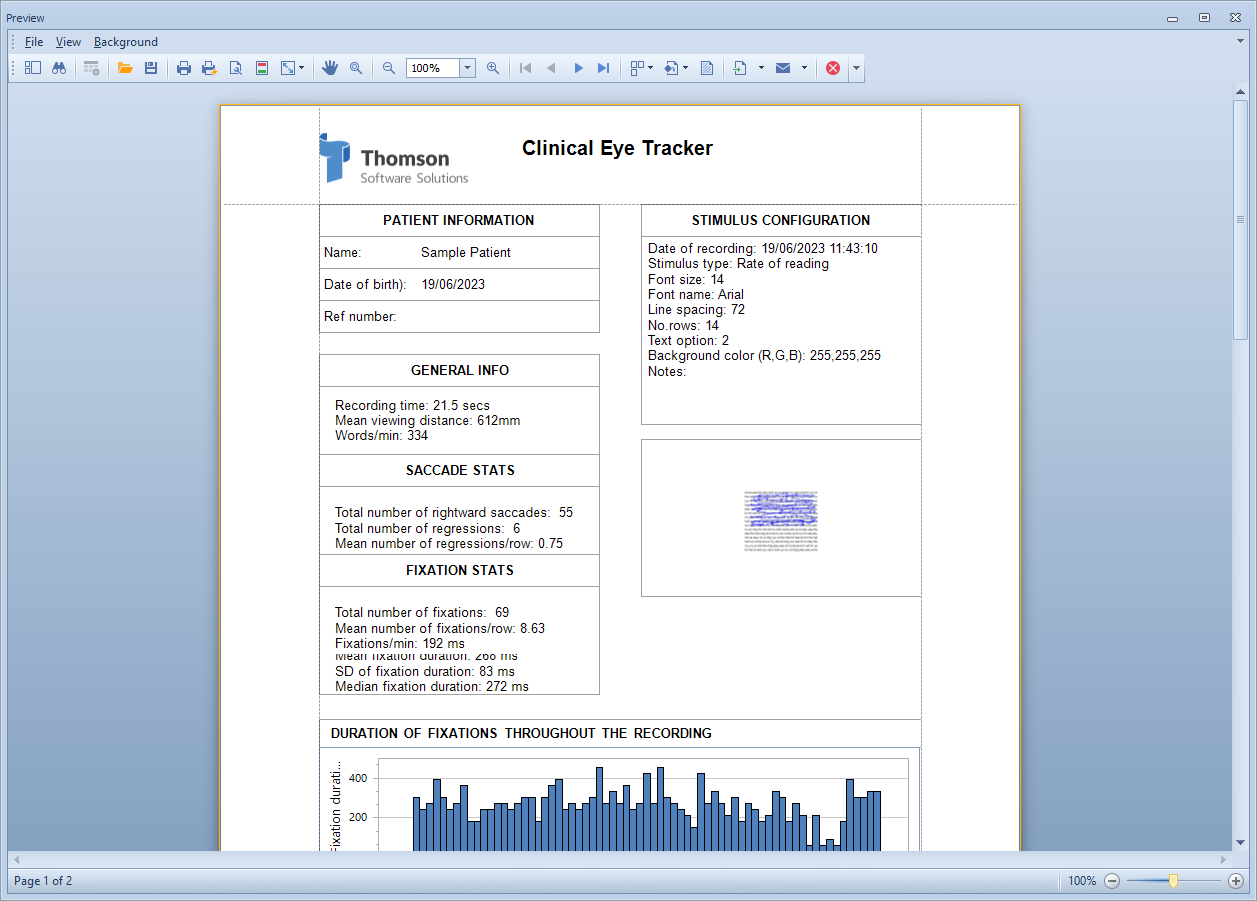
ANALYSIS REPORT
A report showing the Analysis can be printed by selecting the Print button. This will show the Print preview screen as shown below which allows a number of print options to be set before printing.