XY panel
The Gaze metrics panel shows the X/Y gaze position of the eyes - i.e. where the eyes were fixating. Data can be shown for both eyes combined or each eye individually by toggling the Binoc / Monoc option on the toolbar.
This information can be presented in a variety of formats using the XY options in the toolbar:
Scanpath: If this option is selected, the XY scan path for the whole recording is displayed (see above).
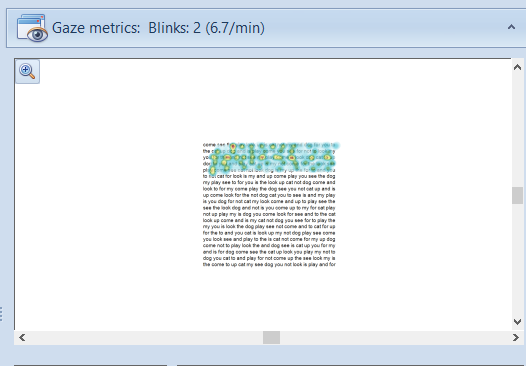
Show Heat map: If this option is selected a heat map is displayed (as shown below). This gives a graphical representation of the time that the patient spent fixating each section of the image. The cool colours represent shorter fixation times.
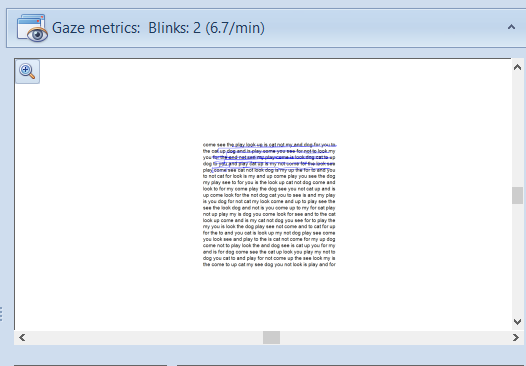
Show model data: If this option is selected, the data is modeled to eliminate the noise and provide a simplified scan path. Selecting Playback .. Play then shows the modeled movements of the eye. This is useful when demonstrating the overall pattern of eye movements when reading for example.
Enlarging the display
The size of the display may be enlarged by resizing the entire panel by dragging the edge (identified by four small dots).
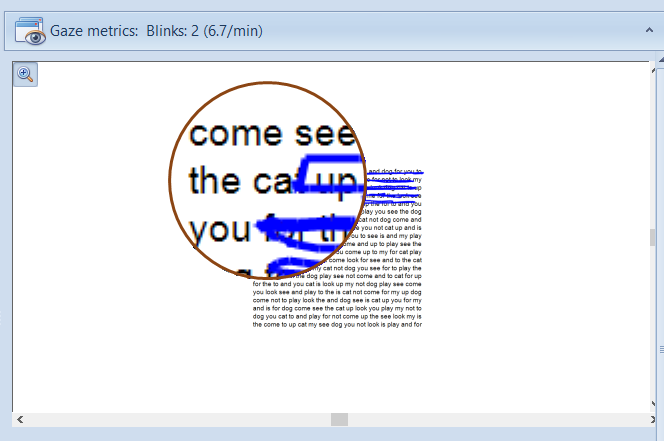
Alternatively, clicking on the magnifying glass icon shows a magnified image of the display to appear at the cursor location as shown below.