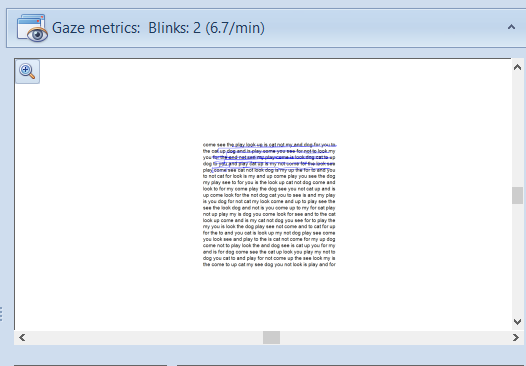
Reading metrics
The Clinical Eye Tracker includes an Analysis module which automatically analyses the pattern of eye movements and produces a statistical summary.
The Analysis module first analyses the eye movement data to identify the beginning and end of each saccade and fixation. This is achieved using an algorithm developed by Thomson Software Solutions.
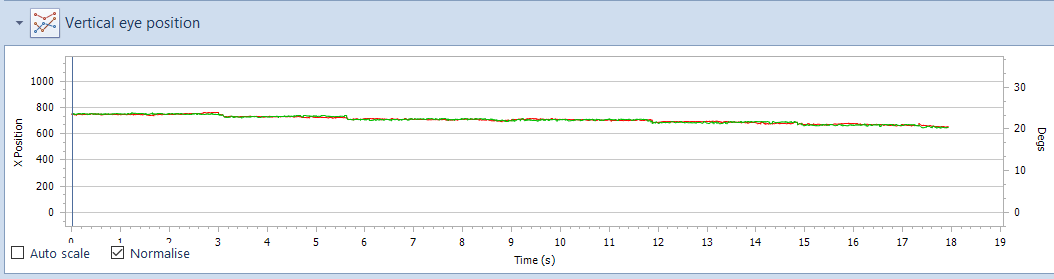
An example of the modeled data (orange) and actual eye position (blue) is shown below:
To show the Analysis window, select Analysis from the toolbar.
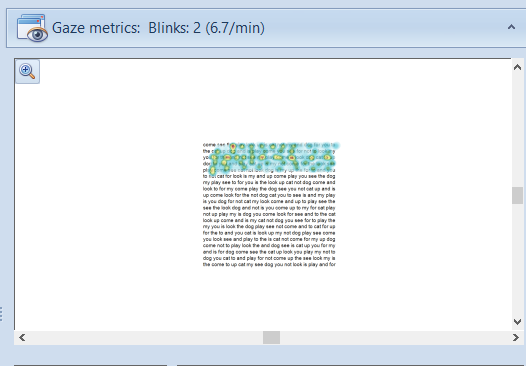
This will display the Analytics window shown below:
NOTE: READING AND NON-READING TASKS
If the recordings were taken during a reading task, the Reading task button in the toolbar should be highlighted as shown above. In this mode, the analysis algorithms will attempt to identify the large saccade at the end of each row which it then uses to calculate the number of rows read, reading speed etc. The outline summary will then show a list of fixations and saccades made while reading each row.
If the recordings were taken during a non-reading task, the Reading task button in the toolbar should NOT BE HIGHLIGHTED. In this mode, the analysis algorithms will measure the fixation and saccade metrics but will not attempt to divide the recording into rows.
NOTE: READING FROM RIGHT TO LEFT
If the recordings were taken during a reading task AND the patient was reading text from Right to Left (e.g. Hebrew), the Reading task button in the toolbar should be highlighted as shown above and the L to R button on the toolbar should be selected (show that it shows R to L). In this mode, the analysis algorithms will attempt to identify the large left to right saccade at the end of each row which it then uses to calculate the number of rows read, reading speed etc.
Outline summary - Reading task
The first panel shows a breakdown of the saccades and fixations identified.
The end of a row is identified by a leftward saccade which meets certain criteria in terms including velocity. The algorithm will fail with very unusual patterns of eye movements which do not include a leftward saccade which meets this criterion.
The top level of the outline includes a summary of the number of saccades and regressions on each row.
Expanding this reveals an analysis of the saccades and fixations made on this row along with the approximated duration of the fixation and size of the saccade.
Note: the accuracy of these measurements is limited by the sampling rate of the hardware (approximately 60Hz) and the accuracy of the eye tracker (approximately 0.5 degrees). A number of alternative eye tracking systems are available from Tobii if greater precision is required.
Clicking on a specific element in the list, automatically moves the cursor on the main display window to the corresponding time on the traces so that each saccade and fixation can be individually identified.
Outline summary - Non-Reading task
The first panel shows a breakdown of the saccades and fixations identified.
Note: the accuracy of these measurements is limited by the sampling rate of the hardware (approximately 60Hz) and the accuracy of the eye tracker (approximately 0.5 degrees). A number of alternative eye tracking systems are available from Tobii if greater precision is required.
Clicking on a specific element in the list, automatically moves the cursor on the main display window to the corresponding time on the traces so that each saccade and fixation can be individually identified.
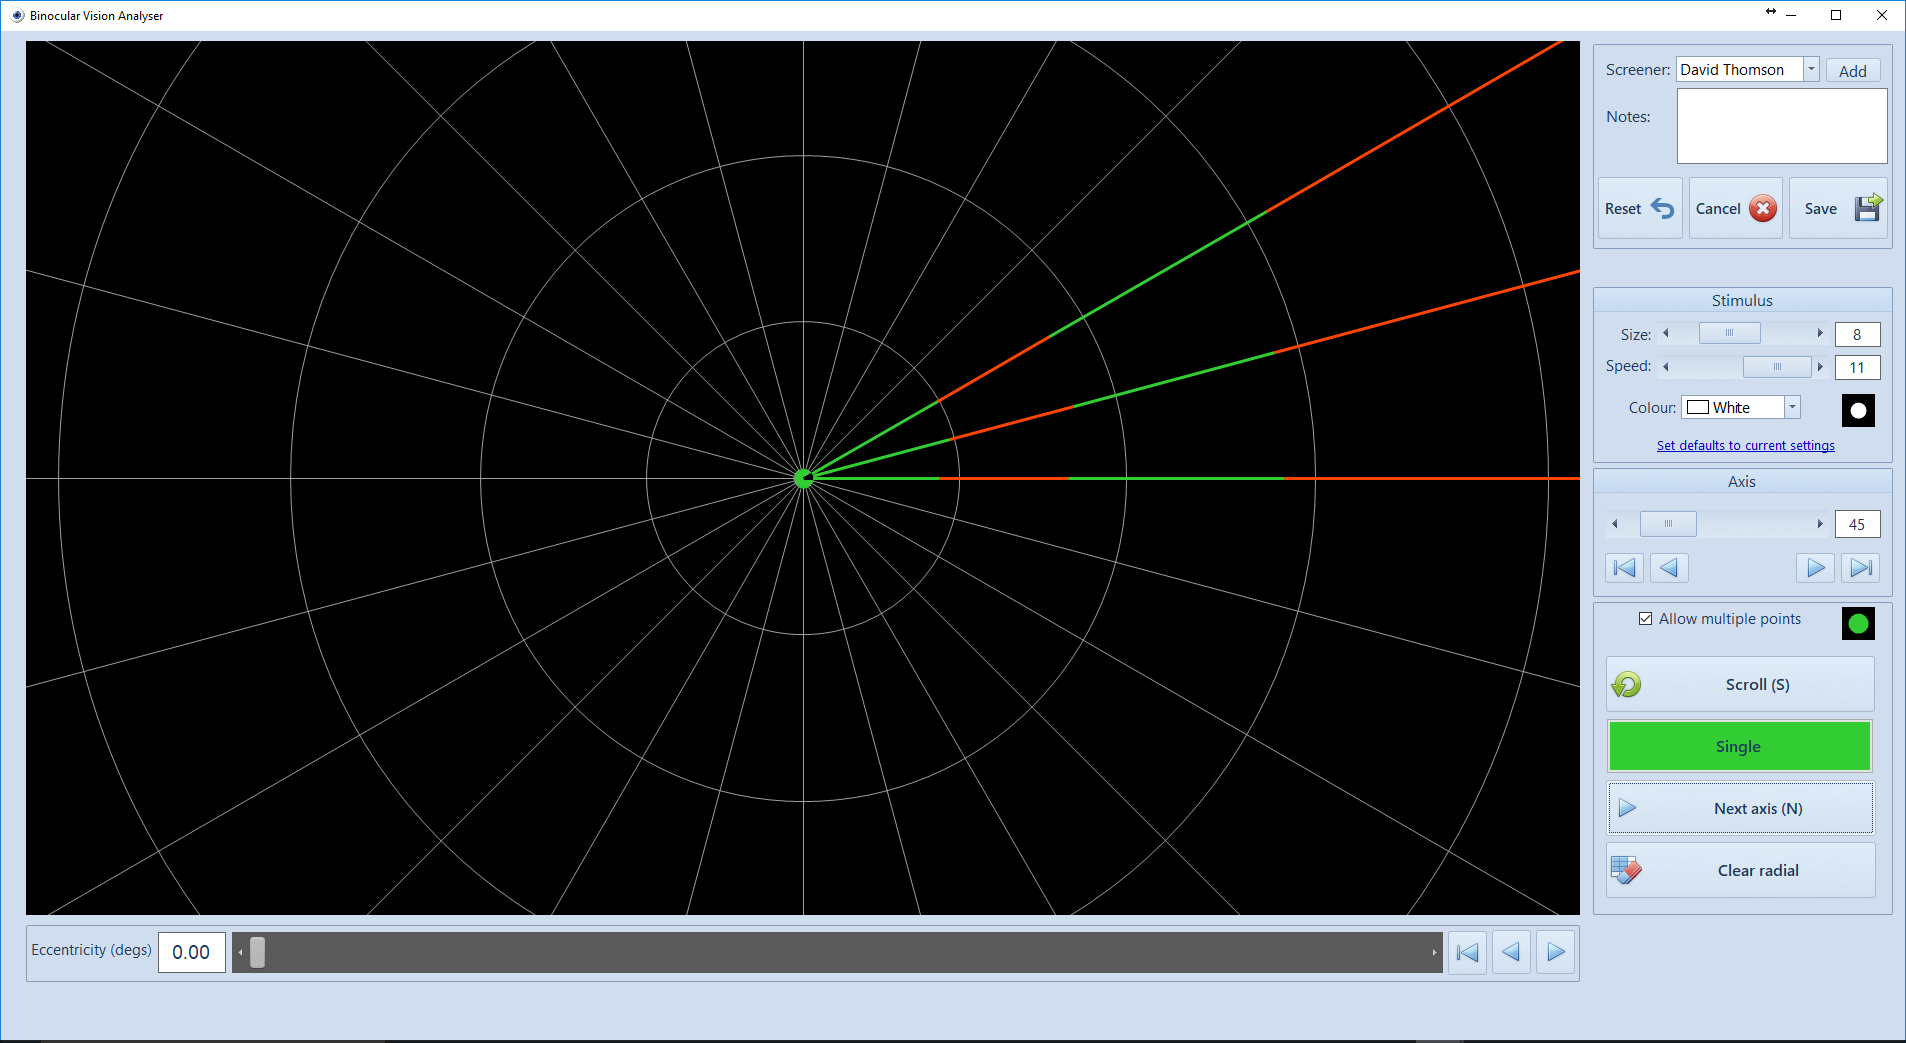
Fixation duration
The estimated duration of each fixation in the recording is shown in the panel shown below:
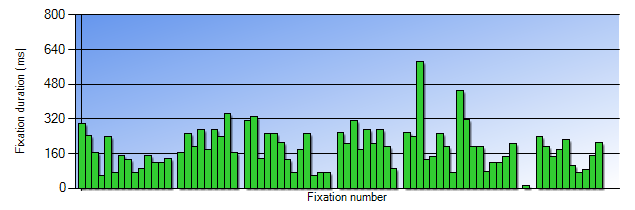
Each row is separated by a space. This graph allows any trends in fixation duration throughout the recording to be readily identified.
Distribution of fixation durations
A frequency distribution of the data shown above is also shown:
This allows a rapid assessment of the distribution of the fixation duration and comparison between patients.
Saccade size
The estimated amplitude of each saccade in the recording is shown in the panel shown below:
Rightward saccades are shown as positive and leftward saccades as negative. The normal pattern of eye movements when reading therefore consists of a series of small rightward saccades, followed by a large leftward saccade as the eyes return from the end of the row to the beginning of the next.
Regressions are identified as small leftward saccades.
Distribution of saccade size
A frequency distribution of the data shown above is also shown:

This allows a rapid assessment of the distribution of the saccade size and comparison between patients.
Summary stats
A summary of the outcome of the analysis is shown at the top of the panel:
Reading task mode:
The first column gives the following information:
- No. of rows: number of rows read as identified by the algorithm. If this is incorrect, the value can be edited. This value is used to calculate the Words/min.
- Words/row: this is the average number of words on each row of the text read by the patient. For the Rate of Reading test this is 15. If other text has been used, enter the average number of words on each row.This value is used to calculate the Words/min.
- Recording time: total recording time in seconds
- Words/min: reading speed in words/min based on the No. of rows value, the Words/row and the Recording time.
- Fixations/ min: number of fixations/min based on the total number of fixations detected and the Recording time.
The second column gives the following information:
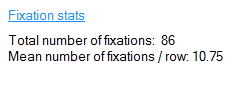
- Total number of fixations: total number of fixations identified during the recording
- Mean number of fixations/row: total number of fixations identified divided by the No. of rows.
The second column gives the following information:
- Total number of rightwards saccades: total number of rightwards saccades identified during the recording
- Total number of regressions: total number of small leftward saccades (regressions).
- Mean number of regressions/ row: total number of regressions divided by No.of rows.
- Regressions / Fixations: total number of regressions divided by the total number of regressions expressed as a percentage.
Non Reading task mode:
A reduced set of summary statistics is available in non-reading task mode.
A report of the analytics can be printed by selecting the Print report button. This will show the Print preview screen as shown below which allows a number of print options to be set before printing.