Step 1
The patient is seated at 40cm (customisable) from a display screen. A touch sensitive screen is useful but not essential.
Metamorphopsia is an important symptom of macular disease. The most commonly used method of detection is the Amsler chart, but this is not quantitative. Other methods require good visual acuity, or costly equipment.
The D-Chart is a novel test for assessing the degree and location of metamorphopsia (distortion) in the central visual field.
The test was developed by Velichko Manahilov and Niall Strang of the Department of Vision Science at Glasgow Caledonian University and David Yorston and Gerry McGowan of Gartnavel General Hospital. Working with Thomson Software Solutions, the original paper-based test has been adapted to run on a PC and a range of additional features and functionality has been added.
The test is designed to used by hospital eye clinics and optometrists and anybody else who is required to monitor central field changes in macula disease.

The patient is seated at 40cm (customisable) from a display screen. A touch sensitive screen is useful but not essential.
The patient's details are entered into the software.
And the test conditions specified.
One eye is covered.
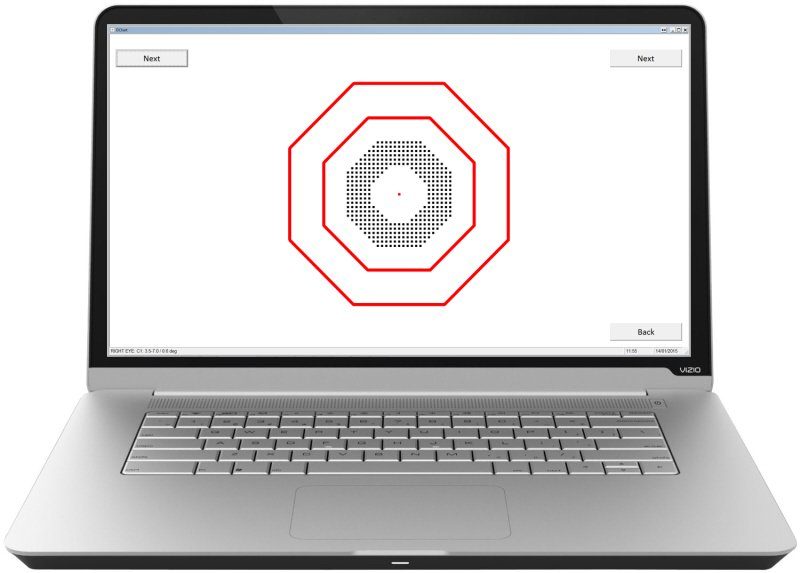
The patient is instructed to look at the red dot in the centre of the dots or the centre of the red octagons (if they have a central scotoma). The patient is then asked to report if any of the dots look fainter or any appear to be distorted. The patient can indicate the sector where this occurs by touching the screen (touchscreen systems) or using a mouse.
The patient is instructed to look at the red dot in the centre of the dots or the centre of the red octagons (if they have a central scotoma). The patient is then asked to report if any of the dots look fainter or any appear to be distorted. The patient can indicate the sector where this occurs by touching the screen (touchscreen systems) or using a mouse.
Sectors that have been selected are indicated by a blue line as shown. Having recorded this information, pressing NEXT moves to the next screen.
The next screen is exactly the same except the density of the dots has been decreased. This makes it more difficult for the patient to see the distortion. The process is repeated until either the patient no longer sees any distortion or the density of dots reaches its minimum value. The density of dots at which this occurs in each segment is recorded as a measure of the degree of metamorphopsia.
The entire process is then repeated with an annulus of dots in order to assess the parafoveal region.
Until a map of morphopsia across the entire central visual field has been built up. The process is then repeated for the other eye and the results analysed.
The lowest density of dots at which the patient could detect distortion is then shown as a "heat map" allowing the location and severity of the distortion to be assessed at a glance.
The results are automatically stored in the database allowing changes in the central field field to be assessed over time. Reports may be printed or exported to a spreadsheet for further analysis.