
Turn your iPad Air into a powerful vision assessment tool
Over the past two decades, computerised Test Charts have replaced the “box-on-the-wall” Snellen Chart for distance vision testing. However, until recently there was no equivalent system for near vision testing and eye care practitioners were forced to uses a variety of cards, books and boxes.
The advent of Tablets has changed all that and have become the ideal medium for presenting a range of near vision tests.
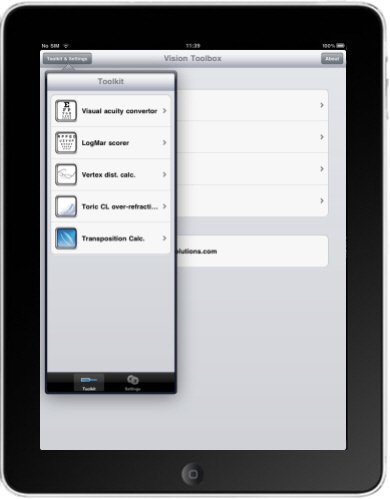
The Vision Toolbox was one of the first apps to exploit the capabilities of Tablets to provide optometrists, orthoptists and ophthalmologists with a huge range of tests on their phone or tablet device. Since its launch, it has been downloaded by hundreds of eye care professionals around the world.
Who is it for?
The Vision Toolbox turns a smartphone or tablet into a powerful and versatile vision assessment tool for Optometrists, Ophthalmologists, Orthoptists and other eye care professionals. The App offers an unrivalled suite of test charts and vision tests for both distance and near vision testing.
Access different tests by simply rotating the iPad and view variations by swiping the screen. Select the test that you want directly by viewing the thumbnail gallery and draw on the screen using your finger. Pan and zoom some of the images or display as a slide show. No eye care professional can afford to be without it!
Key Features
The App includes a huge range of tests and stimuli. These are categorised into four modes:
- Near tests: A large selection of tests designed for assessing “near vision”. The iPad is held at a typical reading distance (e.g. 40cm) for these tests.
- 3m tests : A range of tests and stimuli designed to be viewed from 3 metres. These may be used within the consulting room or for domiciliary testing.
- Patient information: A selection of images and a video to help explain various eye conditions to patients.
- Calculators: A number of calculators to help with those tricky optical calculations
A more detailed look at the Vision Toolbox
Reading Test Types
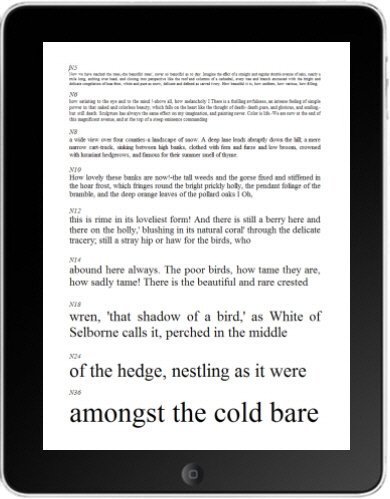
This group displays conventional reading test types calibrated in point size (N5, N6, N8 etc.) where the point size refers to the height of the body of the letters in units of 1/72 of an inch. By rotating the tablet or smartphone, passages of text suitable for children and adults can be displayed. Text size is changed by simply swiping the screen.
LogMAR Reading Test
At last – a sensible way to measure near visual acuity. Rows of text are arranged according to the LogMAR format.

Reading Test Types
This group displays conventional reading test types calibrated in point size (N5, N6, N8 etc.) where the point size refers to the height of the body of the letters in units of 1/72 of an inch. By rotating the tablet or smartphone, passages of text suitable for children and adults can be displayed. Text size is changed by simply swiping the screen.
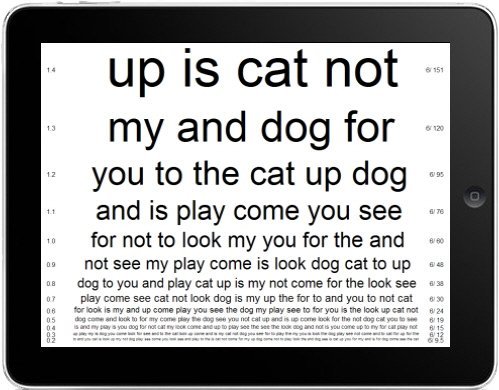
Near LogMAR Reading Charts
At last – a sensible way to measure near visual acuity. Rows of text are arranged according to the logMAR format.
A detailed look at the Vision Toolbox App
Reading Test Types
This group displays conventional reading test types calibrated in point size (N5, N6, N8 etc.) where the point size refers to the height of the body of the letters in units of 1/72 of an inch. By rotating the tablet or smartphone, passages of text suitable for children and adults can be displayed. Text size is changed by simply swiping the screen.
Near LogMAR Reading Charts
At last – a sensible way to measure near visual acuity. Rows of text are arranged according to the logMAR format.
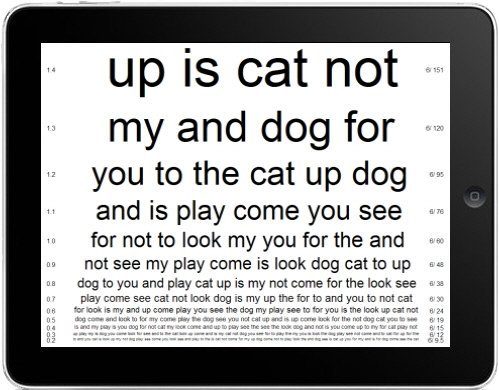
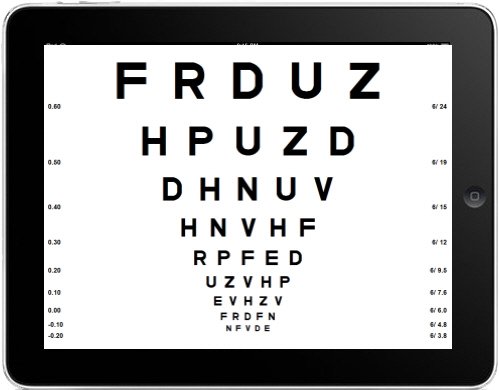
Near LogMAR Chart
Selecting this option displays logMAR charts scaled for viewing at 100cm. The size of the letters is shown in LogMAR units in the left column and Snellen format in the right column. Rotating the tablet or smartphone displays logMAR charts with a variety of optotypes including British, Sloan and tumbling E.

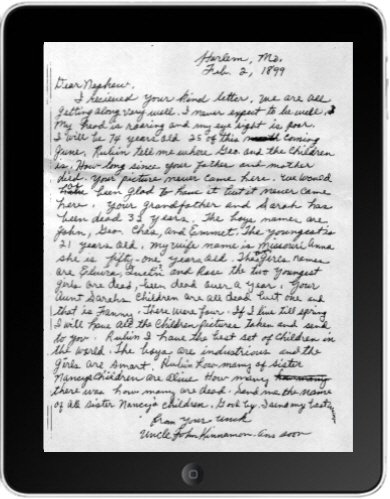
Near Task Simulator
One of the purposes of near vision testing is to ensure that a patient has adequate vision to perform everyday tasks such as reading a newspaper, yellow pages, maps etc.
The Vision Toolbox contains a selection of such images. The magnification of these images can be adjusted by tapping the screen and selecting “Pan and zoom” from the menu. The image can then be moved around by simply moving your finger over the screen. The magnification can be changed by moving two fingers together or apart while touching the screen.
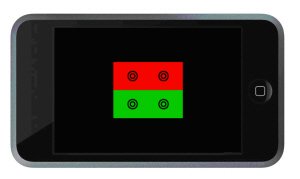
Fixation Disparity
Assess horizontal and vertical fixation disparity using the fixation disparity test stimuli with a red/green visor. Unique test design provides excellent stimulus for accommodation and binocular lock.
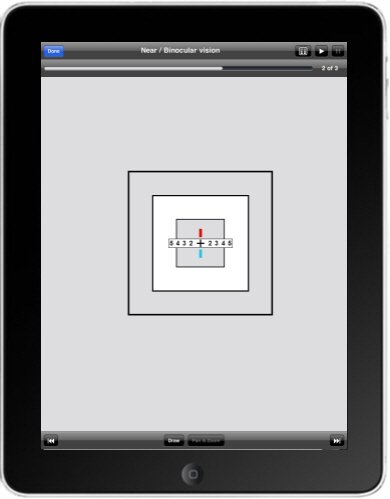
Binocularity
The Binocularity test is designed to assess the ability of the brain to integrate information from both eyes. The first two letters are seen by the right eye (assuming the red filter is in front of the right eye), the middle letter is seen by both eyes and the last two letters are seen by the left eye. The patient is asked to read the letters. Patients with good binocularity will read the complete words. If a patient reads CHA it implies that they are suppressing the left eye while reading AIN suggests that they are suppressing the right eye. Some grading of binocular status is possible by recording the smallest word that can be read completely.
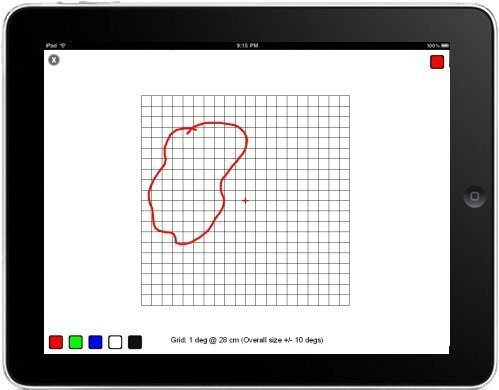
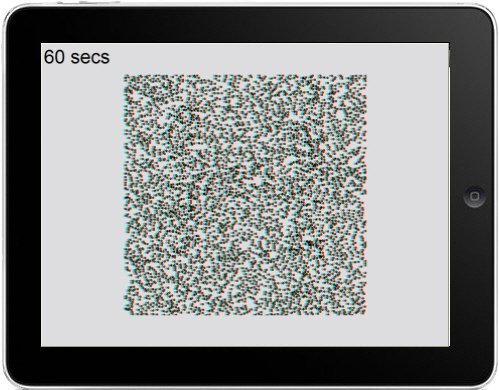
Amsler Charts
The Amsler grid is designed to detect subtle disturbances within the centre of the visual field and is particularly useful for patients with macula disease. A variety of grids are displayed to test different aspects of visual function. Rotating the tablet or smartphone changes the format of the grids. The patient can draw directly on the grid and the resultant image can be saved to the device photo gallery and the shared in the normal way.
Near Duochrome Test
A variety of images can be displayed against a duochrome (red/green) background. This can be used to assess accommodative lag/lead in younger patients and to fine-tune presbyopic corrections for older patients.
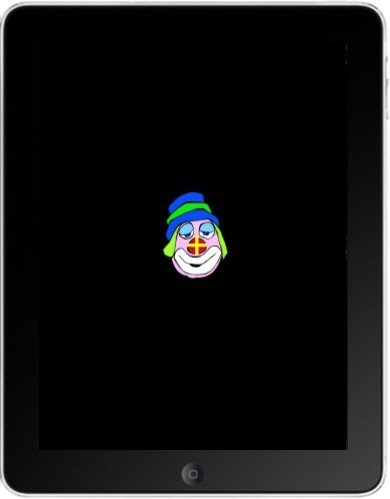
Near Fixation
A series of images are included for the patient to fixate on while the optometrist is performing various tests, for example a cover test. The images (letters, crosses, cartoon characters) can be made to change automatically to form a slideshow by tapping on the screen and selecting “Slideshow” from the menu. The timing and transition between images can be changed from the main Settings menu.
3m Tests
While the Vision Toolbox is primarily designed for near vision testing, it also includes a wide range of tests scaled for 3 metres.
3m LogMAR Chart
The Vision Toolbox includes a wide range of visual acuity charts scaled for 3 metres including LogMAR charts, Snellen charts and single letter charts.
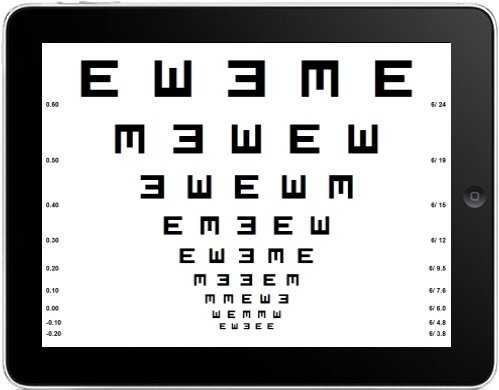
3m LogMAR Chart (Tumbling Es)
A range of optotypes are available including British letters and Tumbling Es.
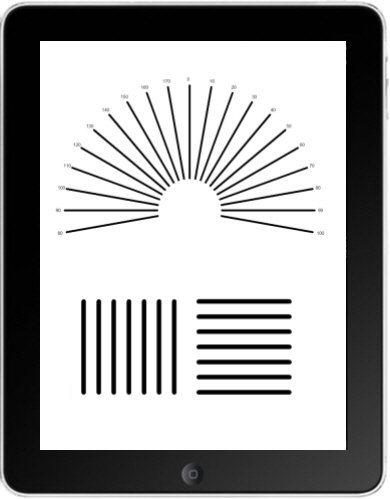
Refraction Stimuli
The Vision Toolbox includes everything you need to do a refraction when you are out and about including the Fan and Block, Cross cyl targets, Duochrome etc.
Binocular Vision Testing
The Vision Toolbox includes a range of binocular vision tests scaled for 3 metres including fixation disparity, Maddox rod and stereopsis.
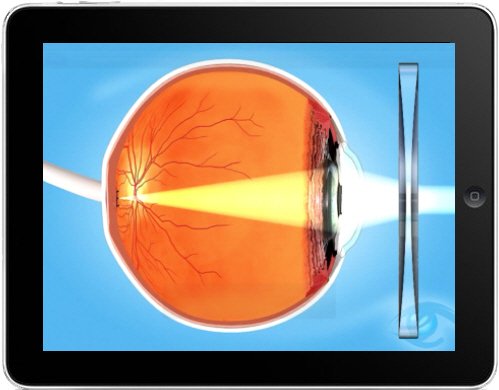
Eye Diagrams
Selecting Eye diagrams displays a series of model eyes to help explain the general anatomy of the eye.

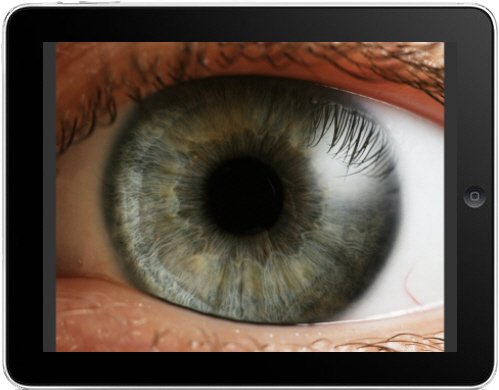
Eye Disease
Selecting Eye disease displays a series of images of eyes with various eye diseases and conditions.
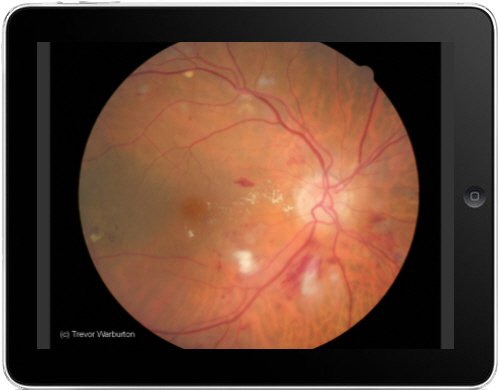
Retina
Selecting Retina displays a series of fundus images.
Videos
Selecting Videos displays a short sample compilation of patient education animations available from Thomson Software Solutions (Insight).
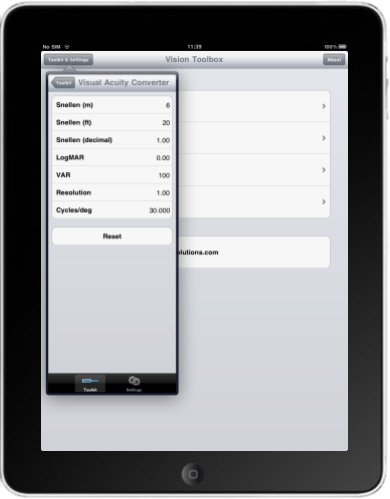
Visual Acuity Converter
This calculator converts visual acuity measurements from one format to another. For example, to calculate the LogMAR equivalent of 6/12, select Snellen (m) and dial in 6/12 and select Done. The screen will be automatically updated to show the equivalent to 6/12 in each of the other formats. To convert from one of the other formats back to Snellen (m), simply select the corresponding format and repeat the process.
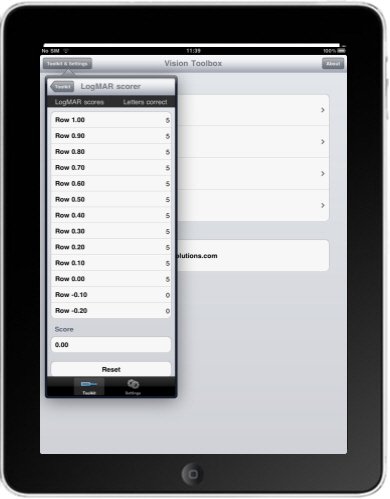
LogMAR Scorer
A LogMAR chart is superior in design to a Snellen chart in a number of respects. However, scoring a LogMAR chart can be confusing for the novice. This tool is designed to assist during this learning phase. Simply enter the number of letters that the patient reads correctly on each row and the LogMAR score will be calculated automatically and displayed at the bottom of the screen.
Vertex Distance Calculator
This tool calculates the equivalent power of a sphero-cylindrical lens on the eye taking account of the vertex distance. This can be useful when fitting contact lenses for patients with higher prescriptions.

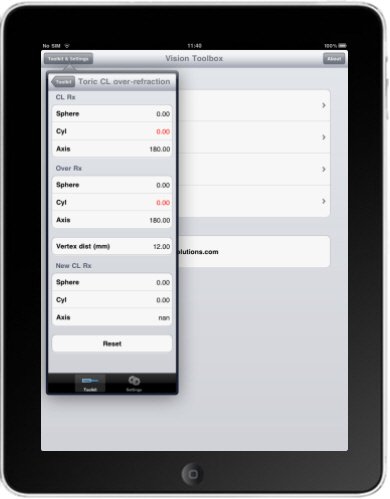
Toric Contact Lens Over-Refraction Calculator
This tool calculates the residual refractive error when an over-refraction is carried out when wearing a toric soft contact lens. Enter the prescription of the toric contact lens in the box labelled CL Rx. Enter the over-refraction results in the box labelled Over Rx. Enter the Vertex distance of the trial frame in the third box. The program will then automatically resolve the two prescriptions and display an estimate of the prescription of the contact lens which should render the patient emmetropic.
Transposition Calculator
This calculator transforms a spectacle prescription from a minus cylinder to plus cylinder format or vice versa. Enter the prescription in either plus or minus cylinder format and the prescription will automatically appear in the alternative format in the other box.
![]()