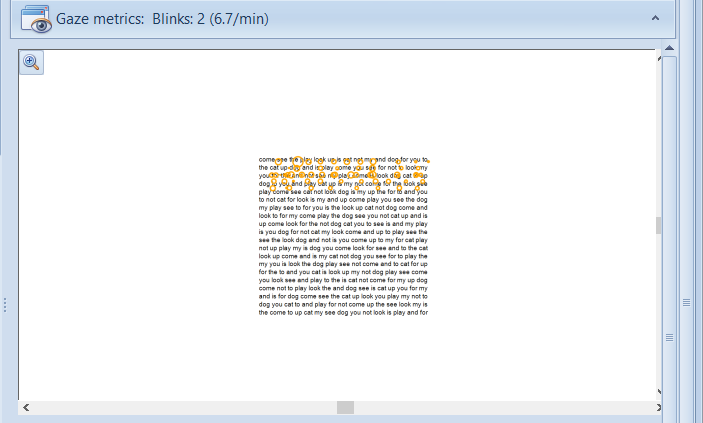
Showing the model gaze trace
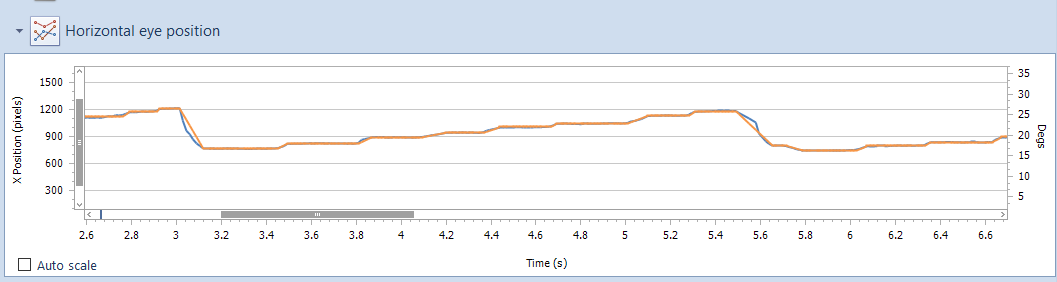
In order to analyse the eye movements when reading, the data is modeled to fit straight lines between the beginning and end of each fixation and the beginning and end of each saccade. These points are identified by an analysis of the first and second differentials of the trace (velocity and acceleration) and applying algorithms developed by Thomson Software Solutions.
The modeled data generally shows a good fit with the actual data but the success of the algorithm is determined to some extent by the quality of the original eye movement recording. Modeled data may be shown by selecting Model Gaze in the toolbar.
An example of the modeled data (orange) and actual eye position (blue) is shown below:
The Modelled data is used as the basis for the Analysis .
When Model data is selected, the Scanpath on the XY display also shows the modelled data with a circle representing each fixation point. The radius of the circle represents the duration of the fixation (larger the radius, the longer the duration).
Playing back the recording while Model data is selected will remove much of the "noise" in the recording and can be useful for presenting the results to patients and identifying significant features.