Displaying results
The Hess test results will be added to the list of results for the selected patients.
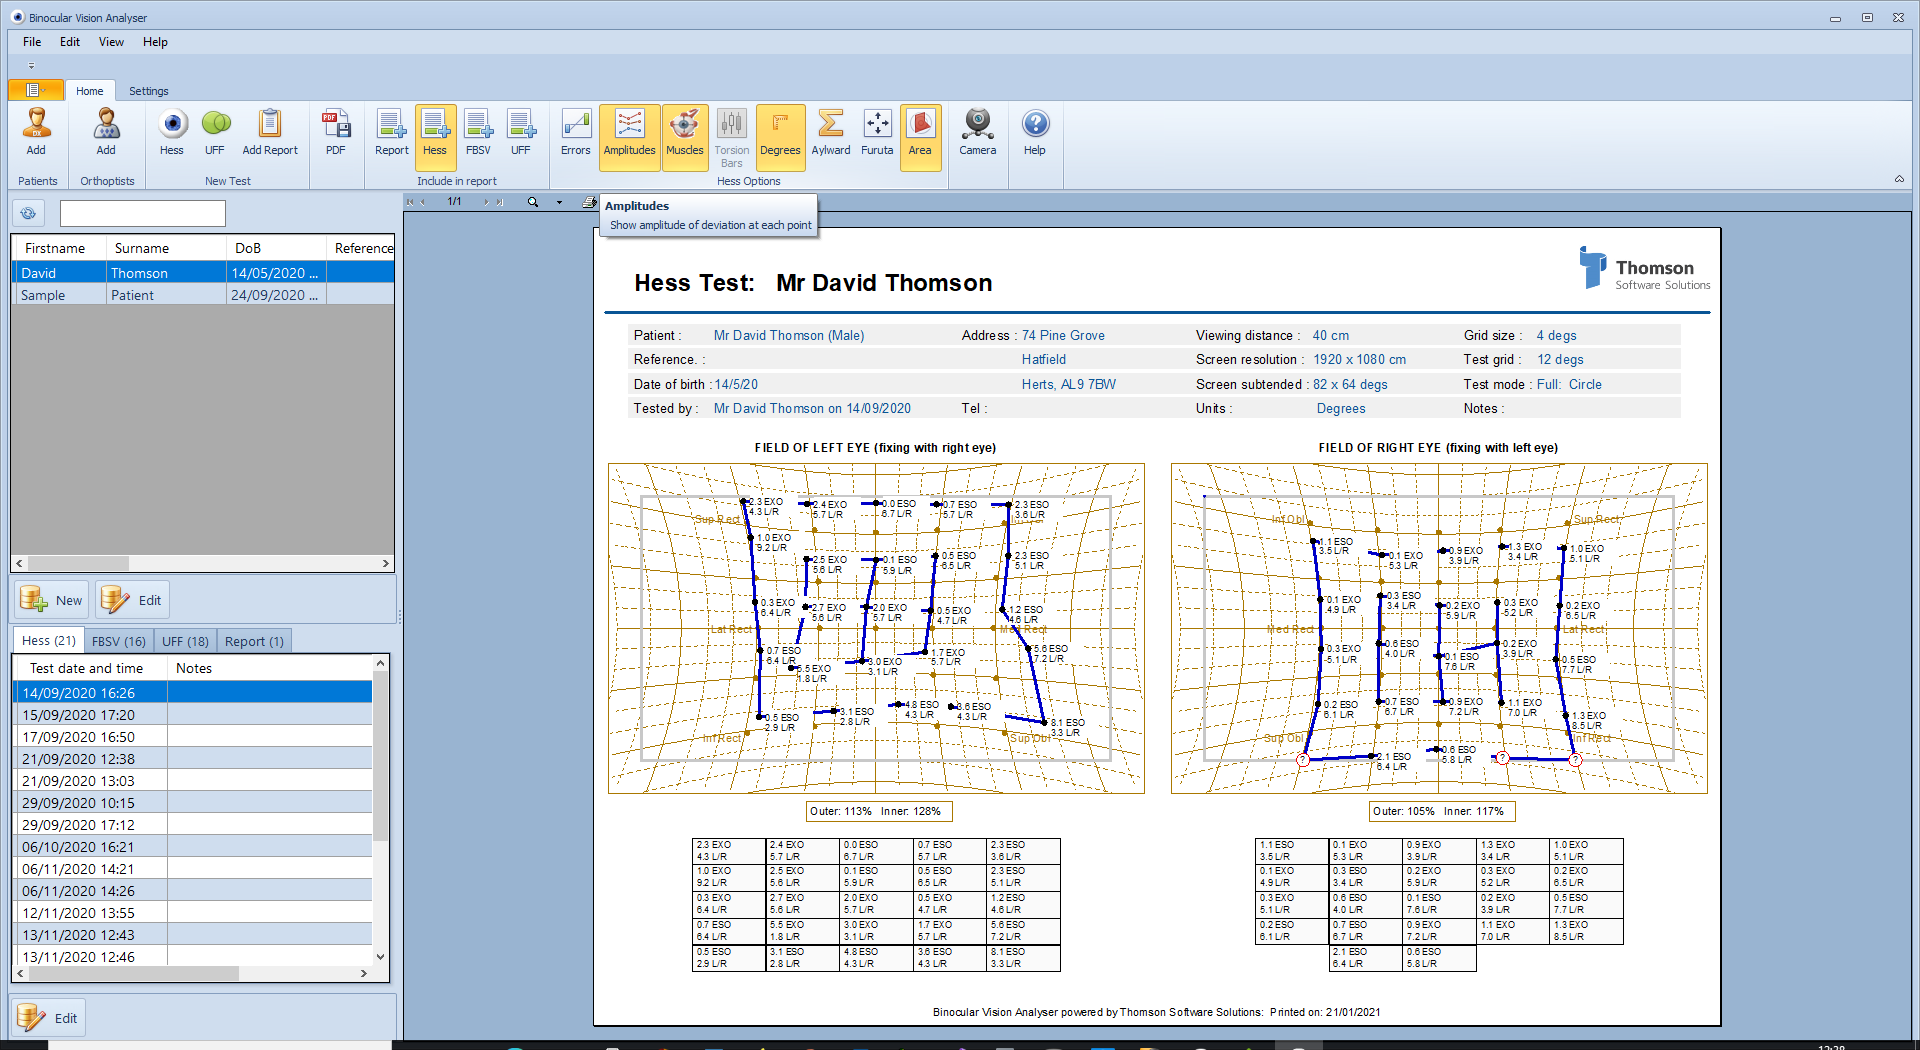
The results of the Hess test will be shown in the familiar format in the report panel as shown below.
The patient's details are shown above the charts and the test conditions are shown below the charts.
The format of the charts may be modified using the Hess options which will now be displayed in the toolbar.
Show errors: if this option is selected a line will be drawn from the target position to recorded position of the stimuls showing the size and direction of the deviation at that point.
Show amplitudes: The amplitude of the horizontal and vertical deviation and the torsion (if measured) is shown in the table below the chart. If the Show amplitudes option is selected the size of the horizontal and vertical deviation at each point will also be displayed on the chart as shown below.
Show muscles: if this option is selected muscle labels are shown on the chart
Torsion bars: if a torsion test has been selected, selecting the Torsion Bars button displays the torsion at each point as shown below.
Prism dioptres/ Degrees: the grid may be shown in units of degrees or prism dioptres by toggling the Prism Diop/Degrees button.
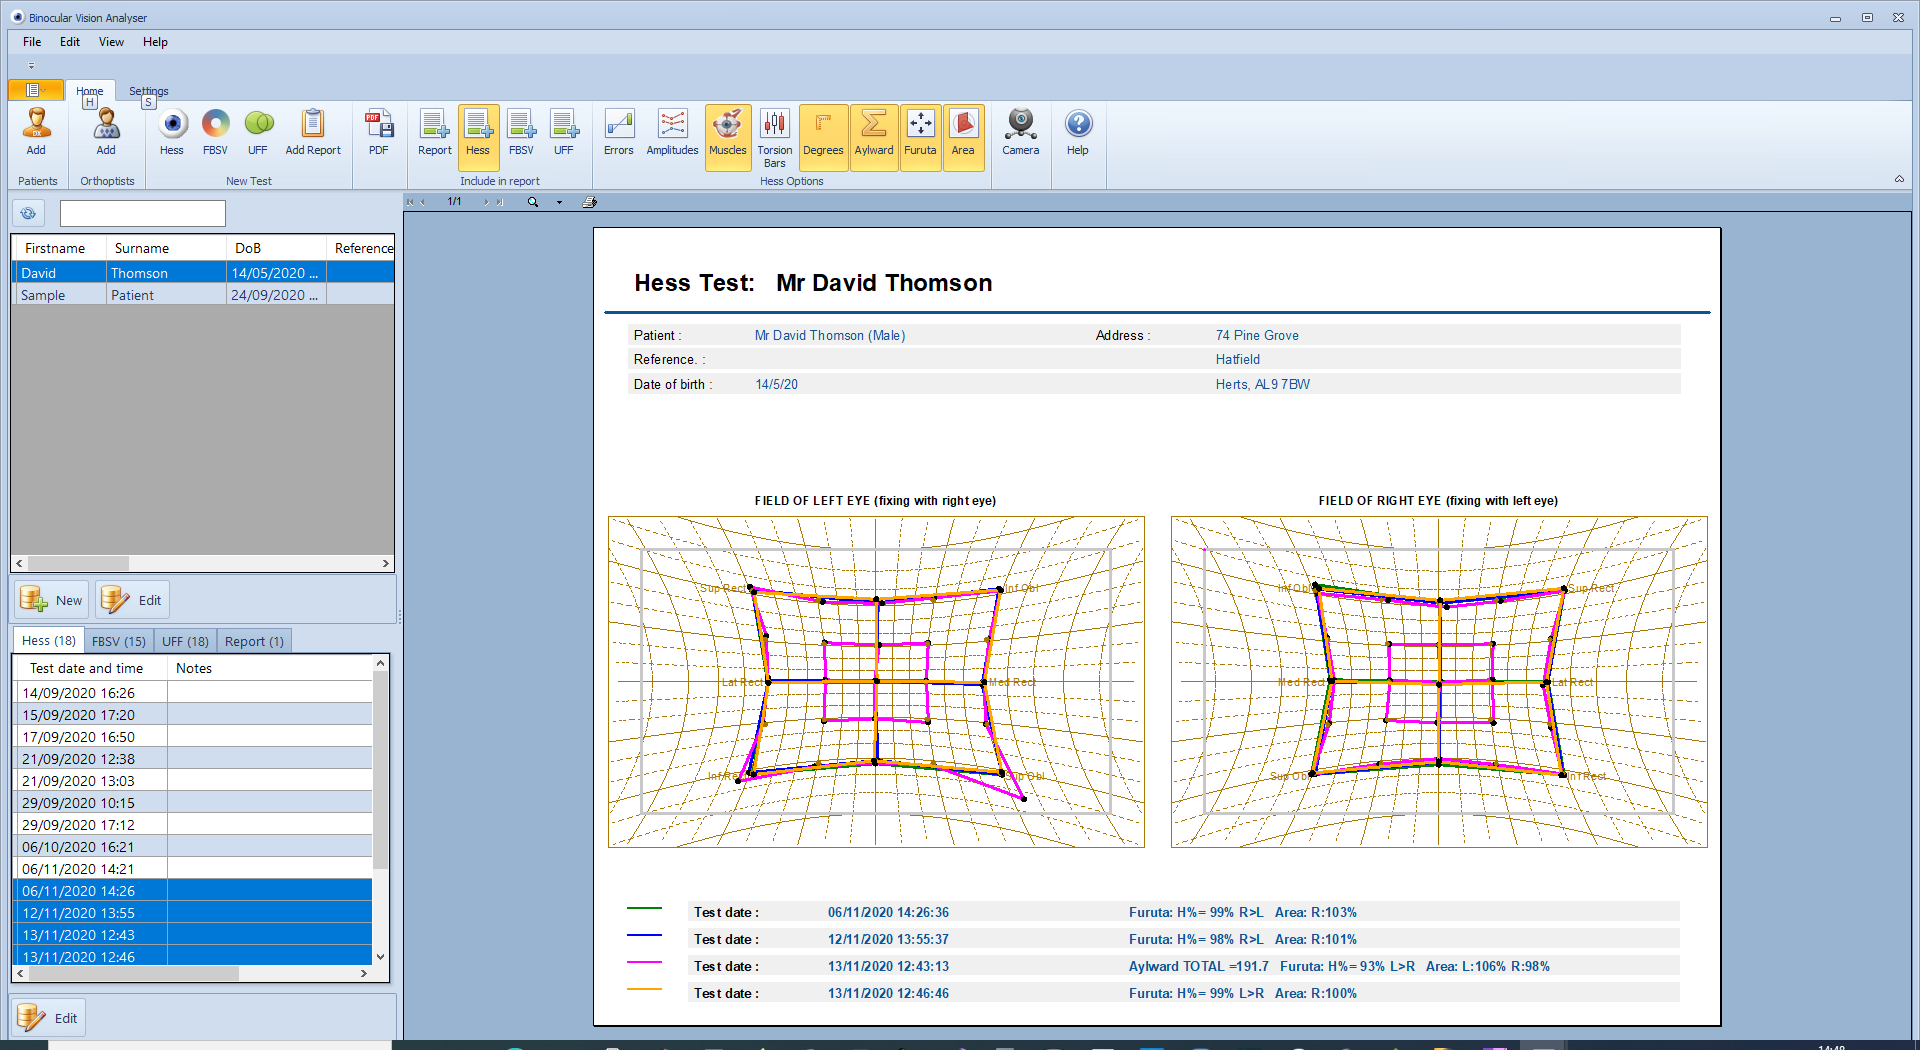
Aylward: If this option is selected, the results of the Aylward analysis are displayed on the chart.
Furuta: If this option is selected, the results of the Furuta analysis are displayed on the chart.
Area: If this option is selected, the area of the plot relative to the area bounded by the targets is shown as a percentage on the chart. An area of greater than 100% implies an overall over-action while a score of less than 100% implies an under-action. The area is calculated for the inner and outer points (when included in the test).
Zooming in
To zoom in on the report either click on the report of the small magnifying glass icon at the top of the report. To select a specific zoom level select the small down arrow next to the magnifying glass.
The magnified report can then be scrolled around by simply dragging the report using the mouse while the left mouse button is held down.
Printing
To print the current report, click on the small printer icon at the top of the report panel. This will display the printer select dialogue window.
A pdf file of the chart can be created automatically by selcting pdf